Chart query results
Charts are notebook blocks or standalone .chart files. Both keep their
configuration and data together, so a chart reopens exactly as you left it.
Chart types
Section titled “Chart types”| Chart | Use it for |
|---|---|
| Line | Trends over time |
| Bar | Comparing categories with long labels |
| Column | Comparing categories vertically |
| Area | Volume or a running total |
| Pie | Composition across a few slices |
| Scatter | The relationship between two numeric measures |
| Dual axes | Two measures with different scales |
| Funnel | Stages or segments ranked by size |
| Heatmap | Intensity across two categories |
| Histogram | The distribution of one numeric field |
| Box | Median, quartiles, and outliers per category |
| Radar | Profiles across several dimensions |
| Stock | Open, close, low, and high per period |
Adjust a chart
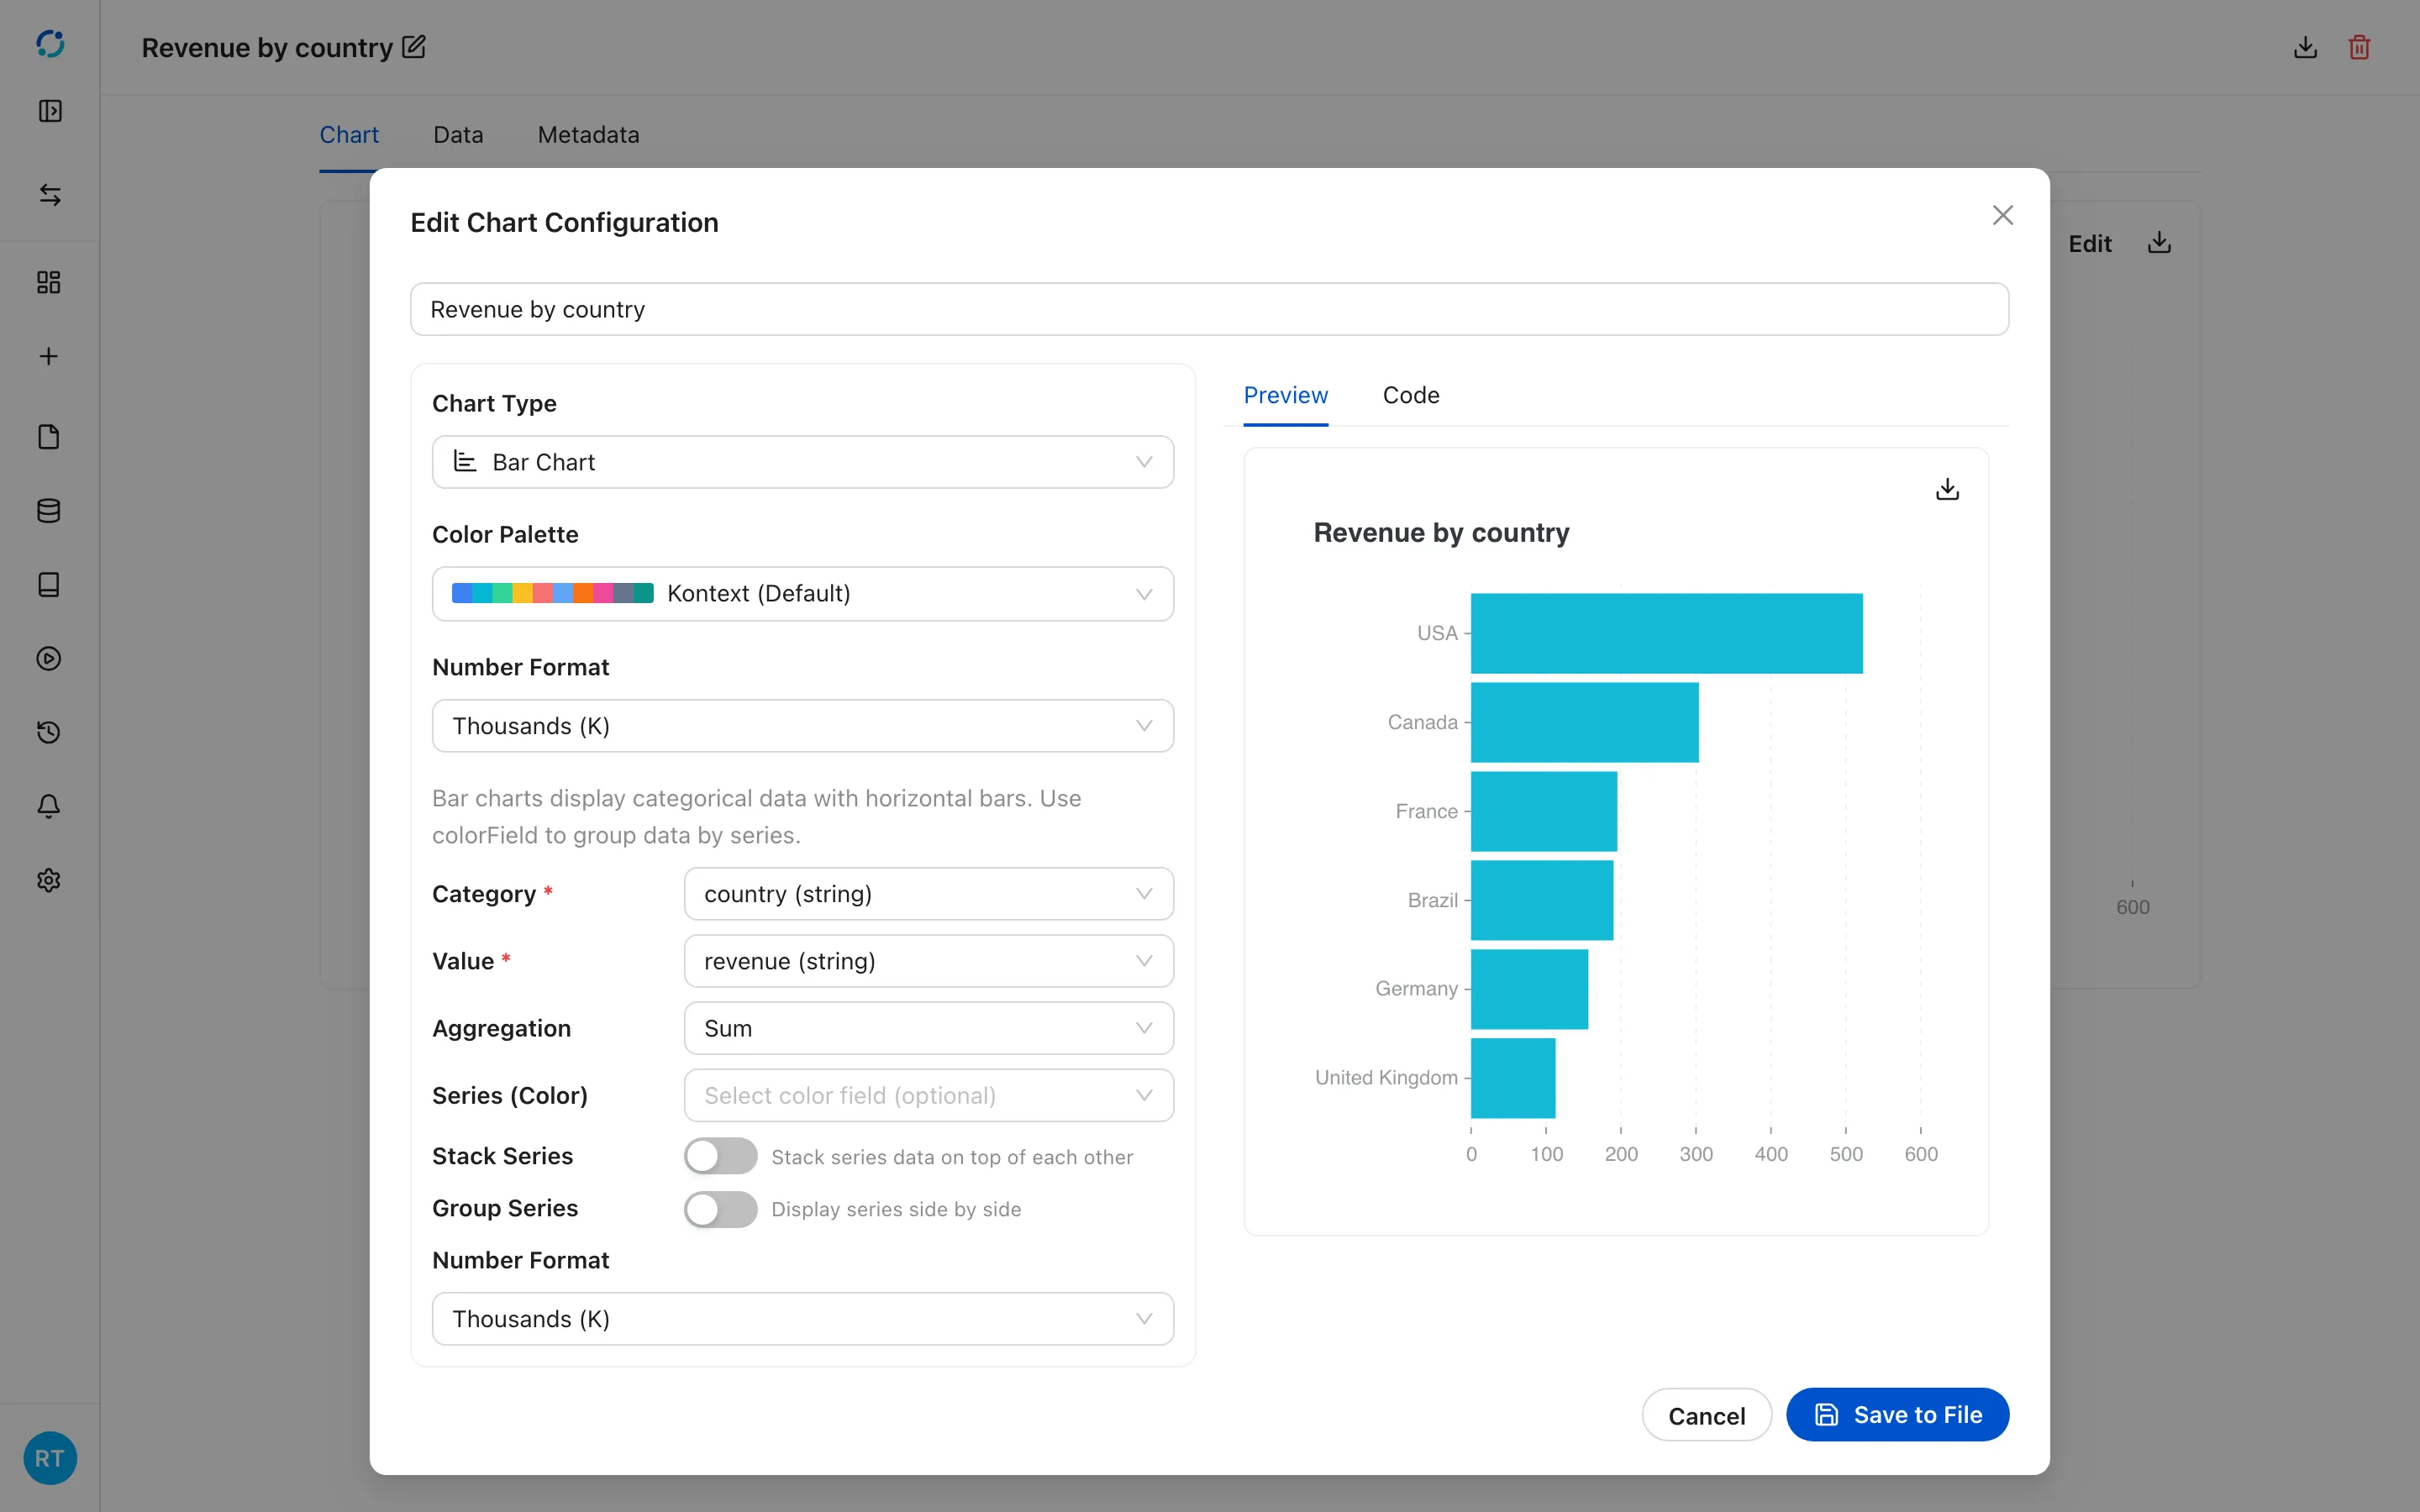
Section titled “Adjust a chart”Select Edit on a .chart file, or the pencil on a notebook chart block. The
editor exposes the chart type, the color palette, the number format, and the
field mapping: category and value, aggregation, series grouping, stacking, and
grouping of side-by-side series. The preview updates as you change a setting, and
Save to File persists the choice.
Charts read either embedded data or a saved data table, and a chart built from a notebook query points at that result table.
- Open a .chart file and select Edit to change its type, fields, palette, and number format.
Export a chart
Section titled “Export a chart”Select the download icon in the chart’s top-right corner to open the export menu:
- Export as Image → PNG Image saves the rendered chart. The file is named after the chart title and uses a white background.
- Export Data → CSV File saves the rows behind the chart for a spreadsheet.
- Export Data → JSON File saves the same rows as structured JSON.
The data options are disabled when the chart has no rows to export.
Every chart type
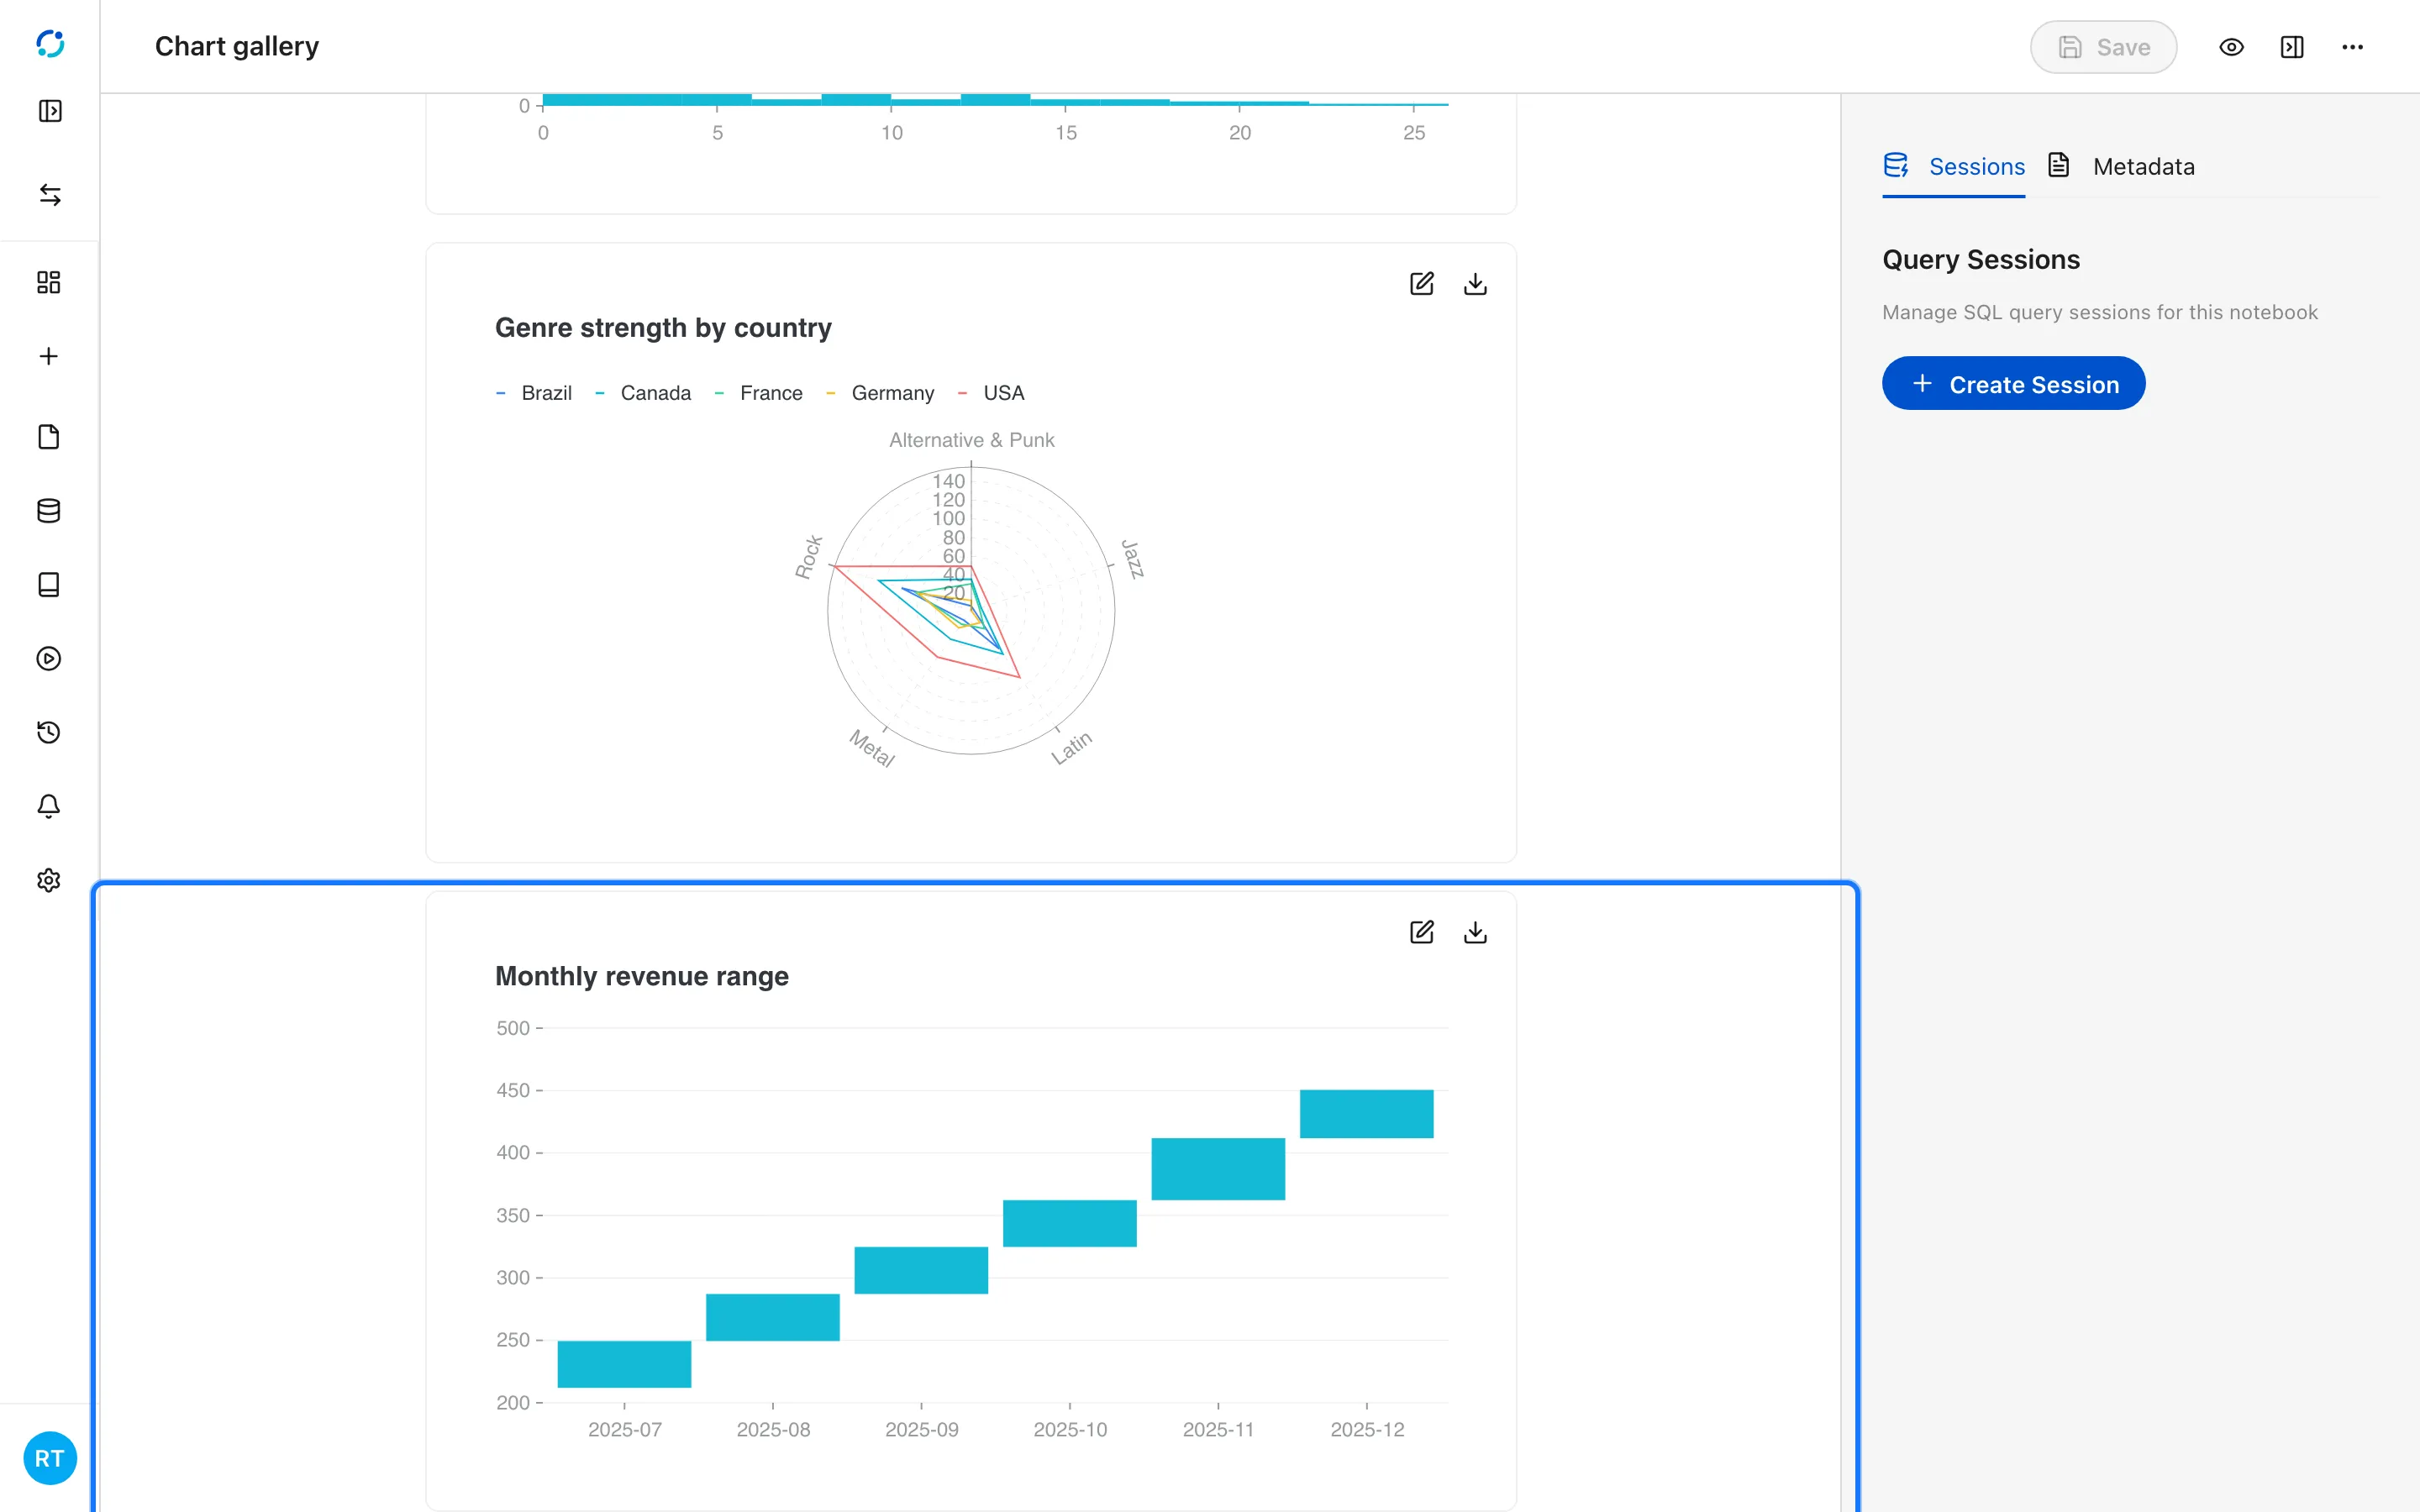
Section titled “Every chart type”The gallery below uses the Chinook store data. Each block keeps its own data table, so the chart is readable without running the notebook.
- Open the chart gallery notebook from the project files.
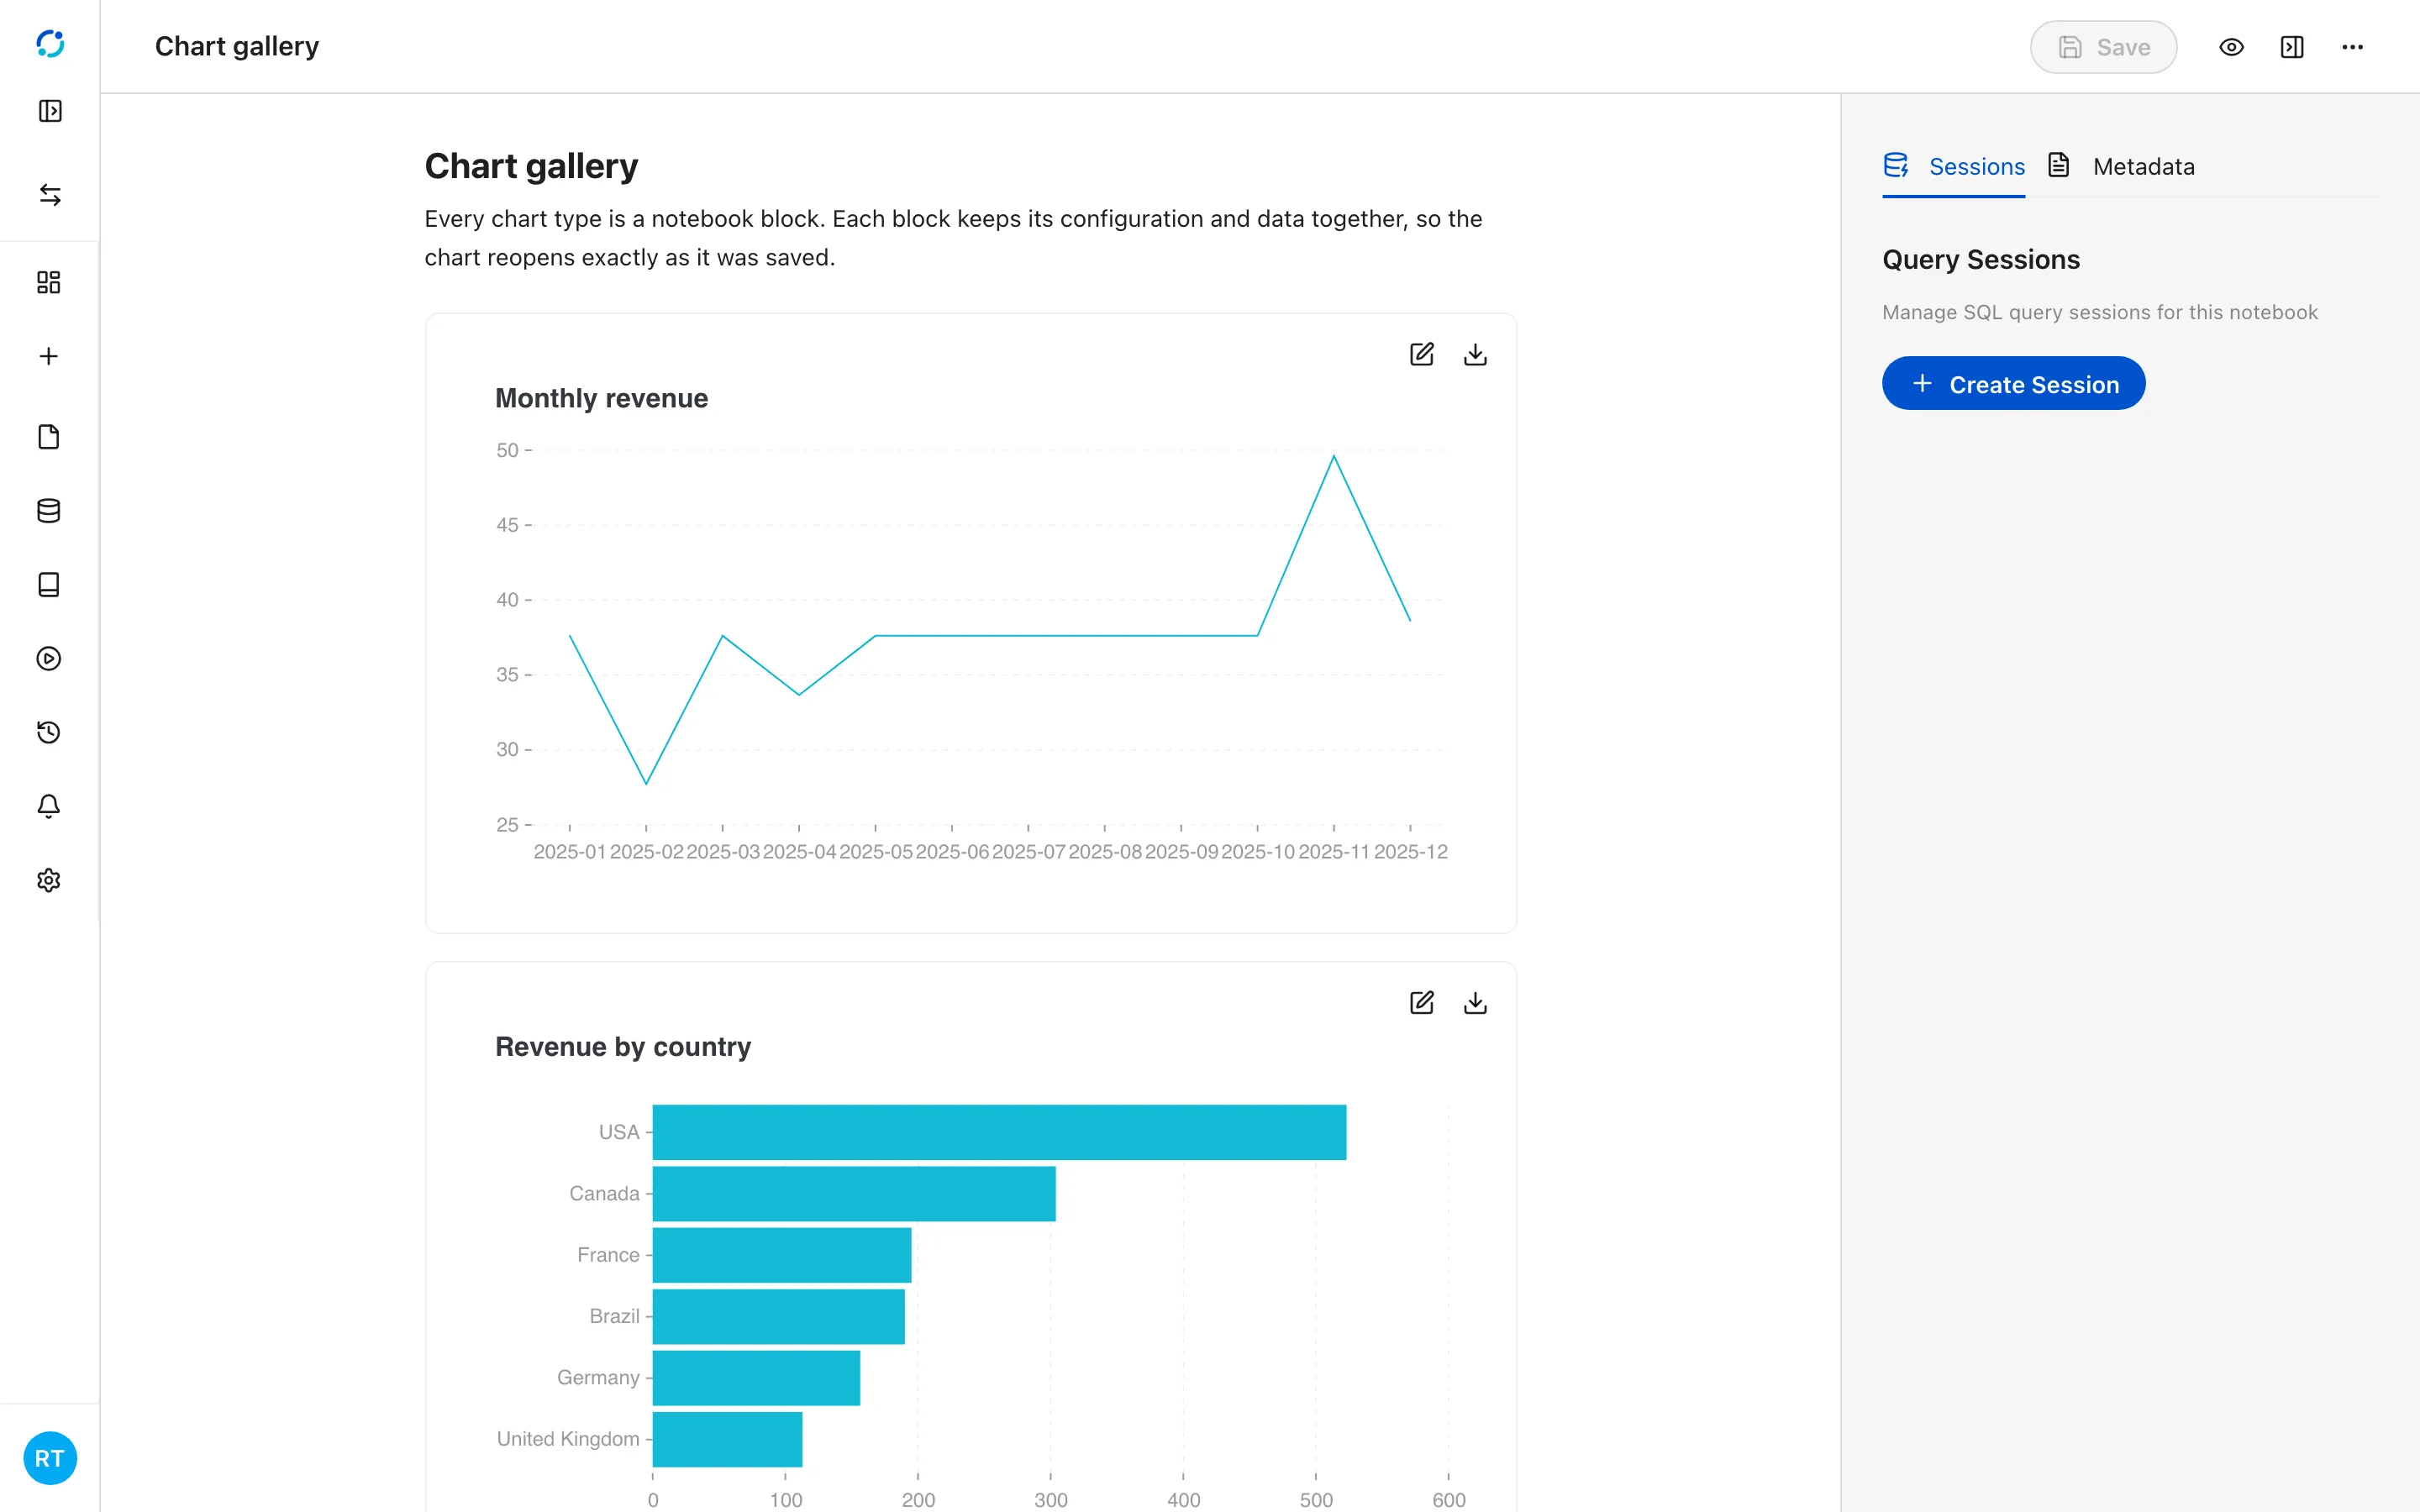
- A line chart shows a measure over time; use it for trends.
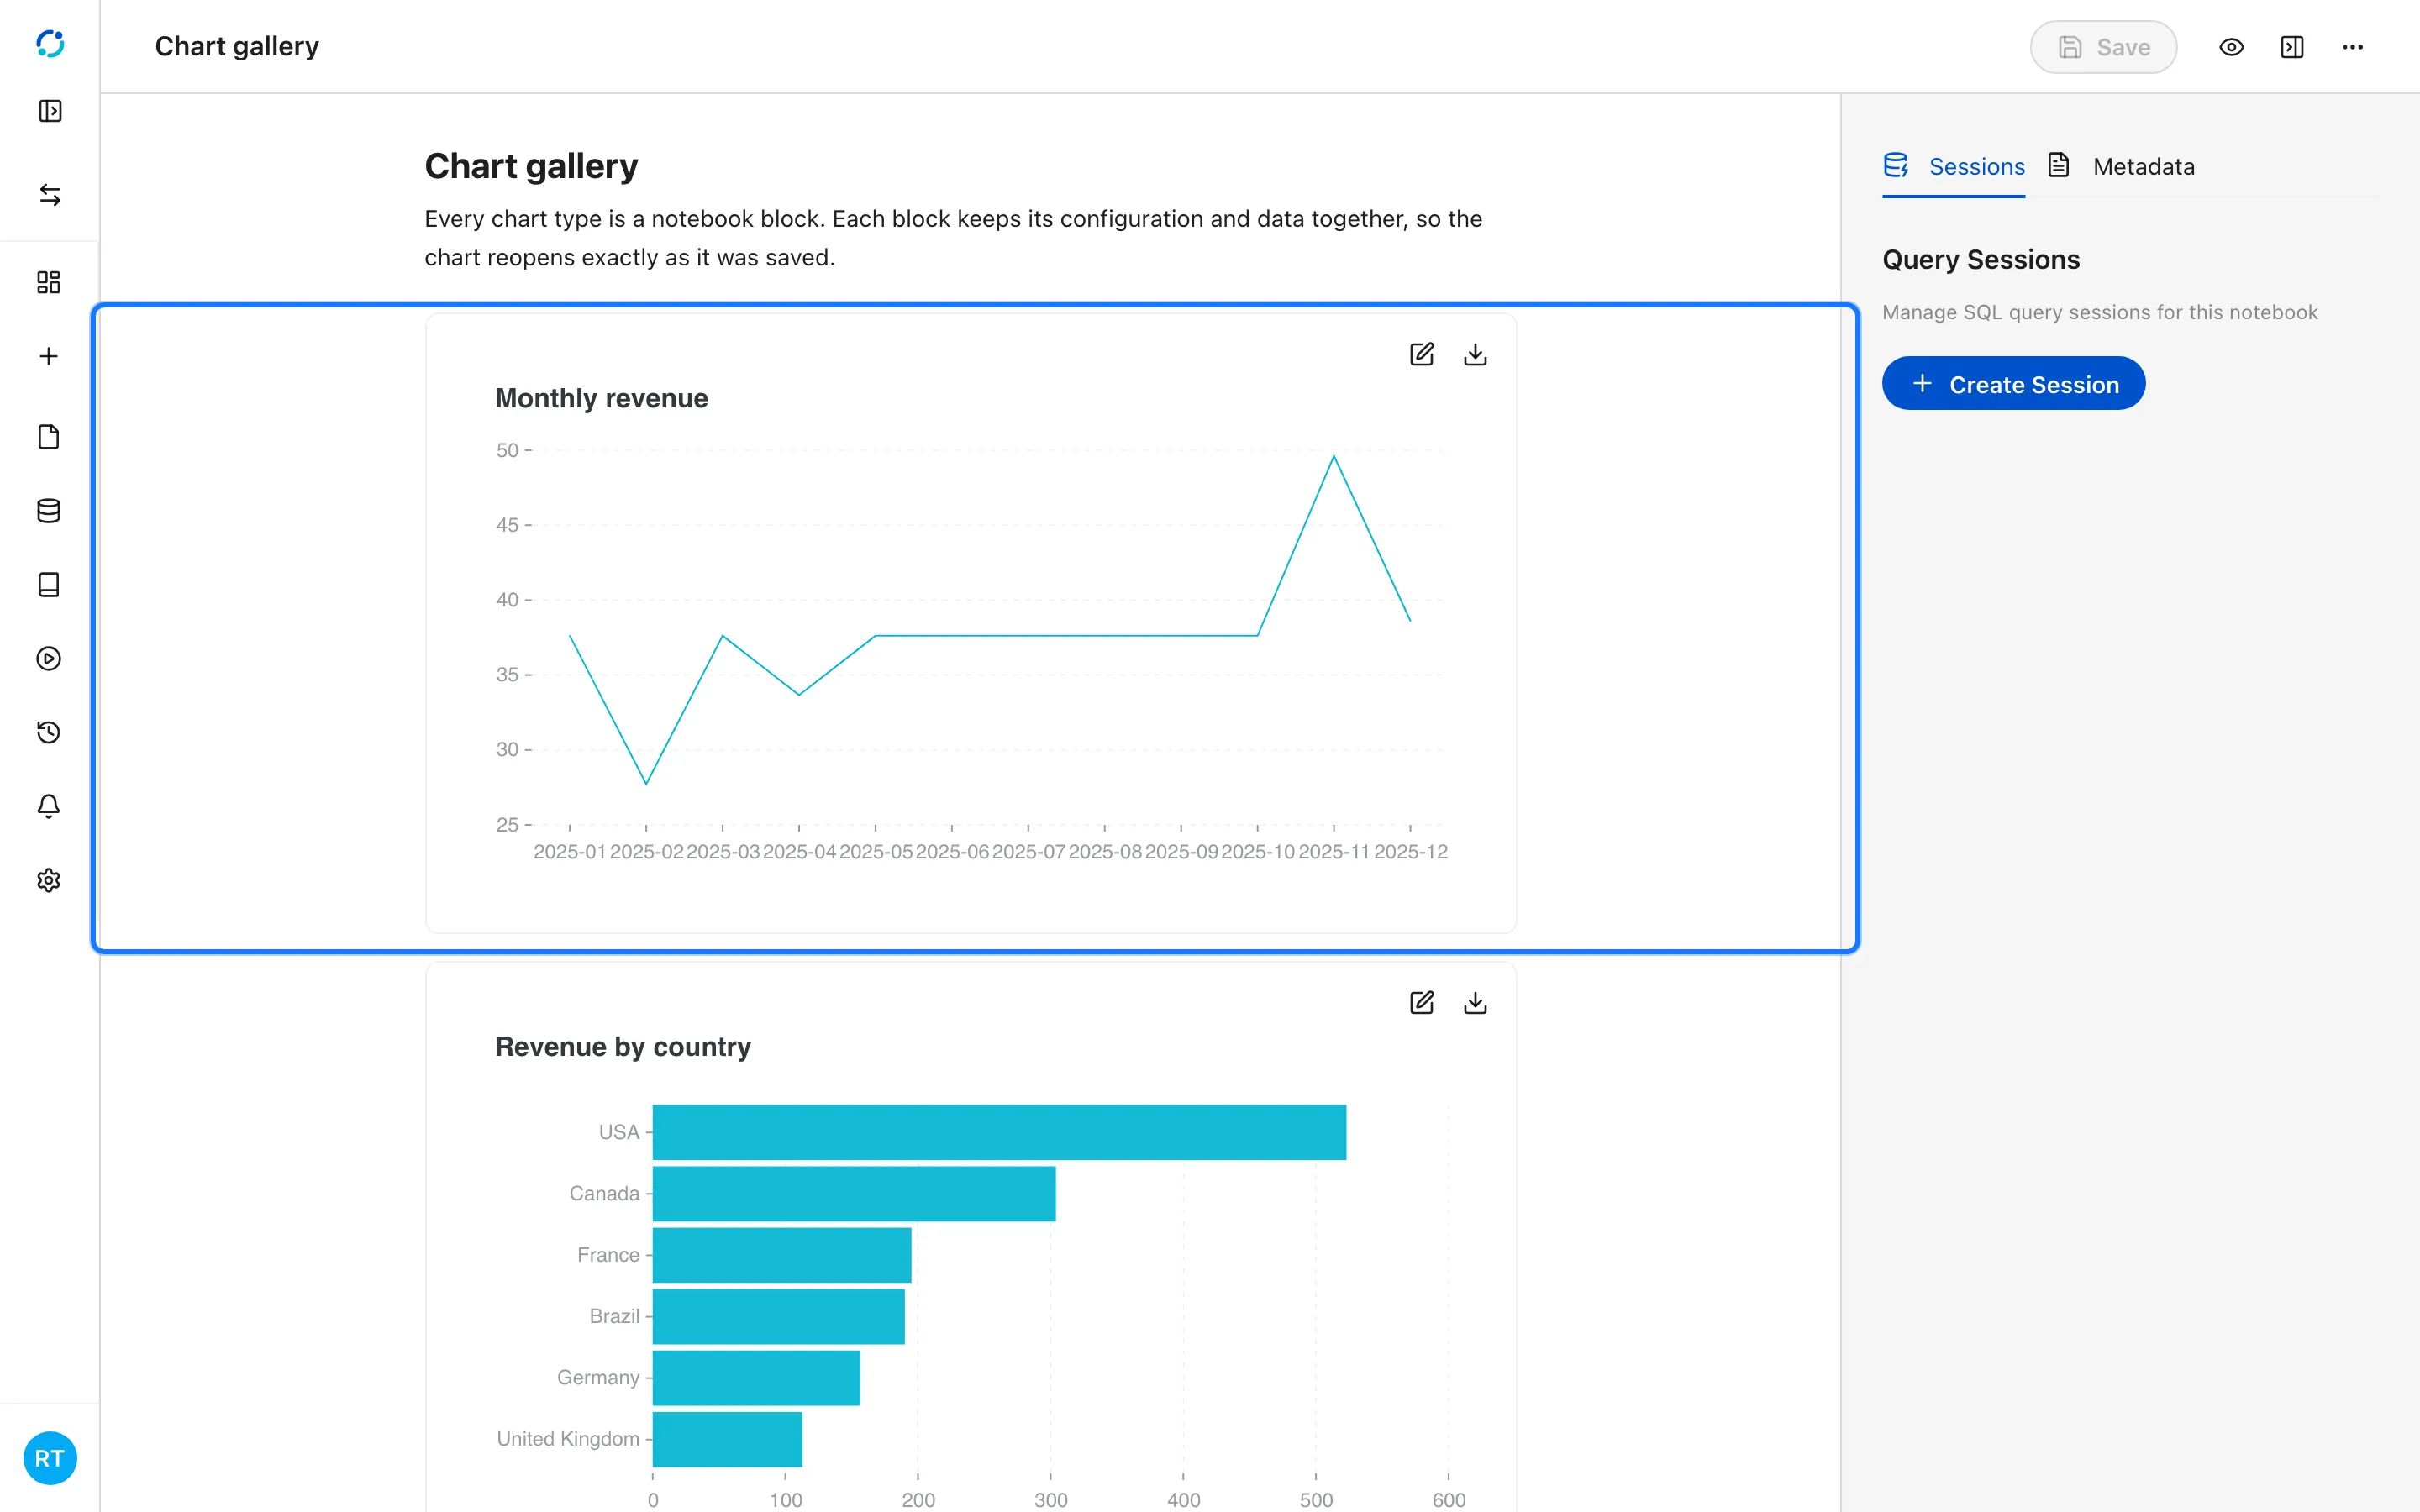
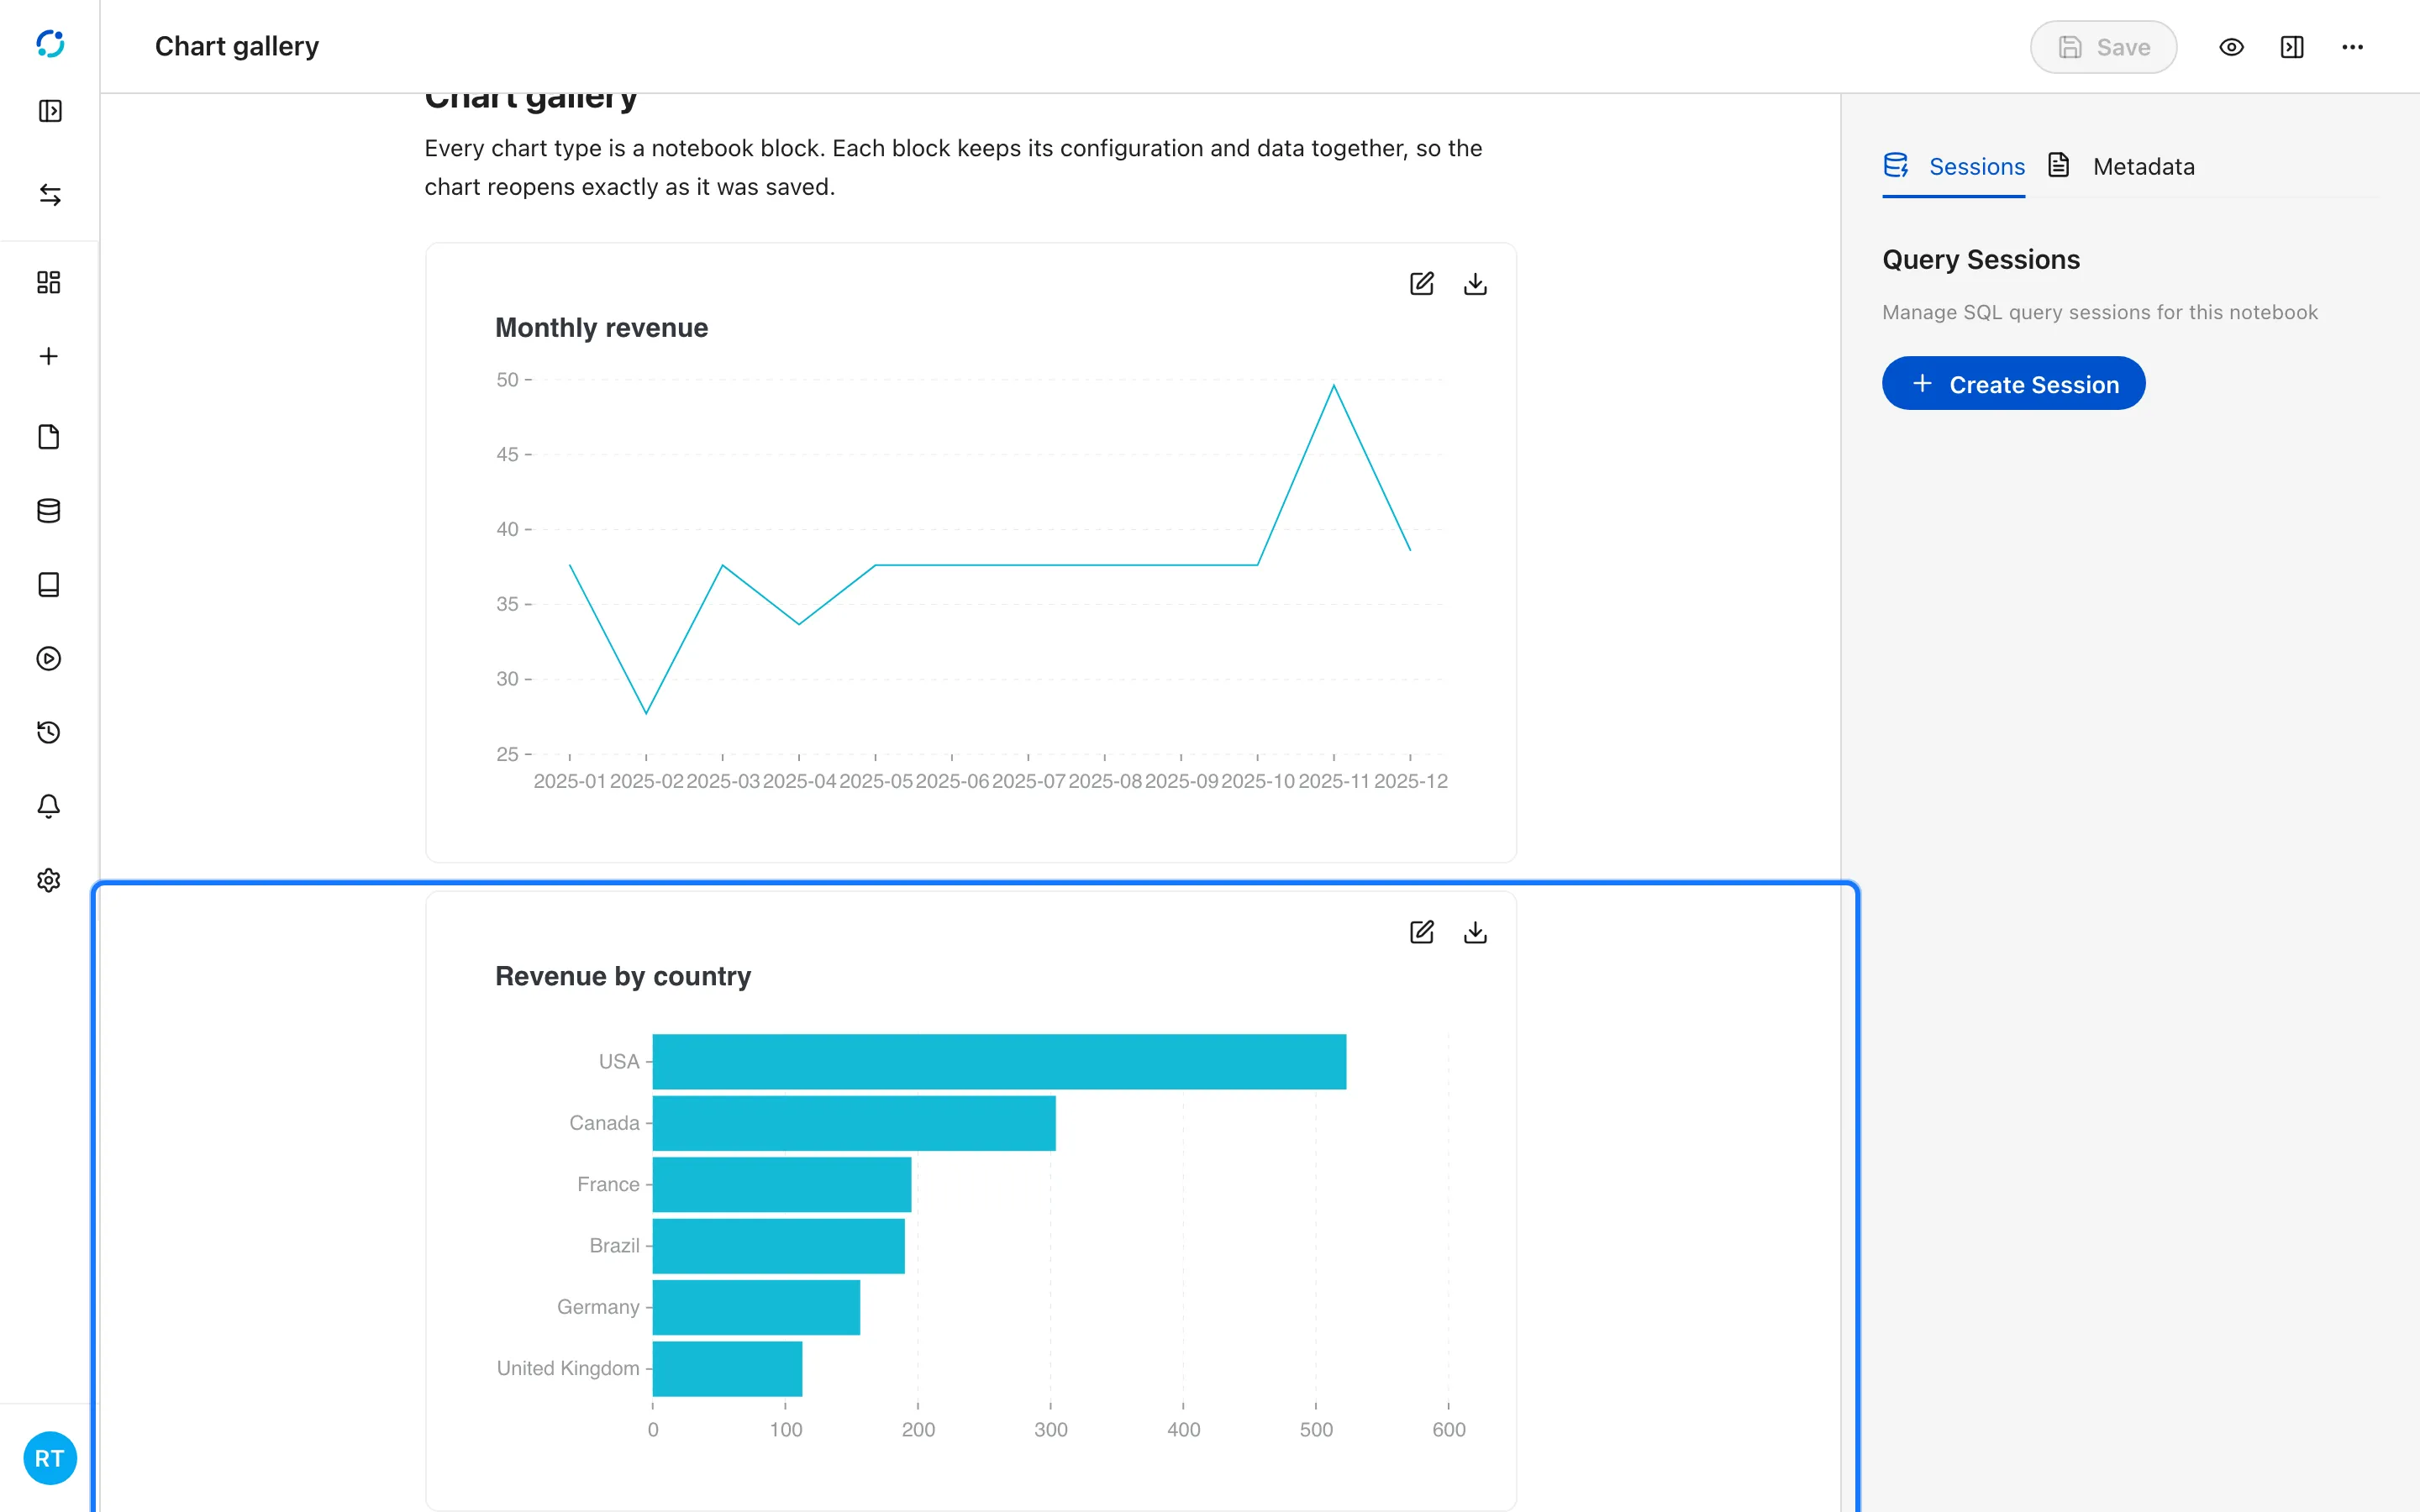
- A bar chart compares categories with horizontal bars, which stay readable with long labels.
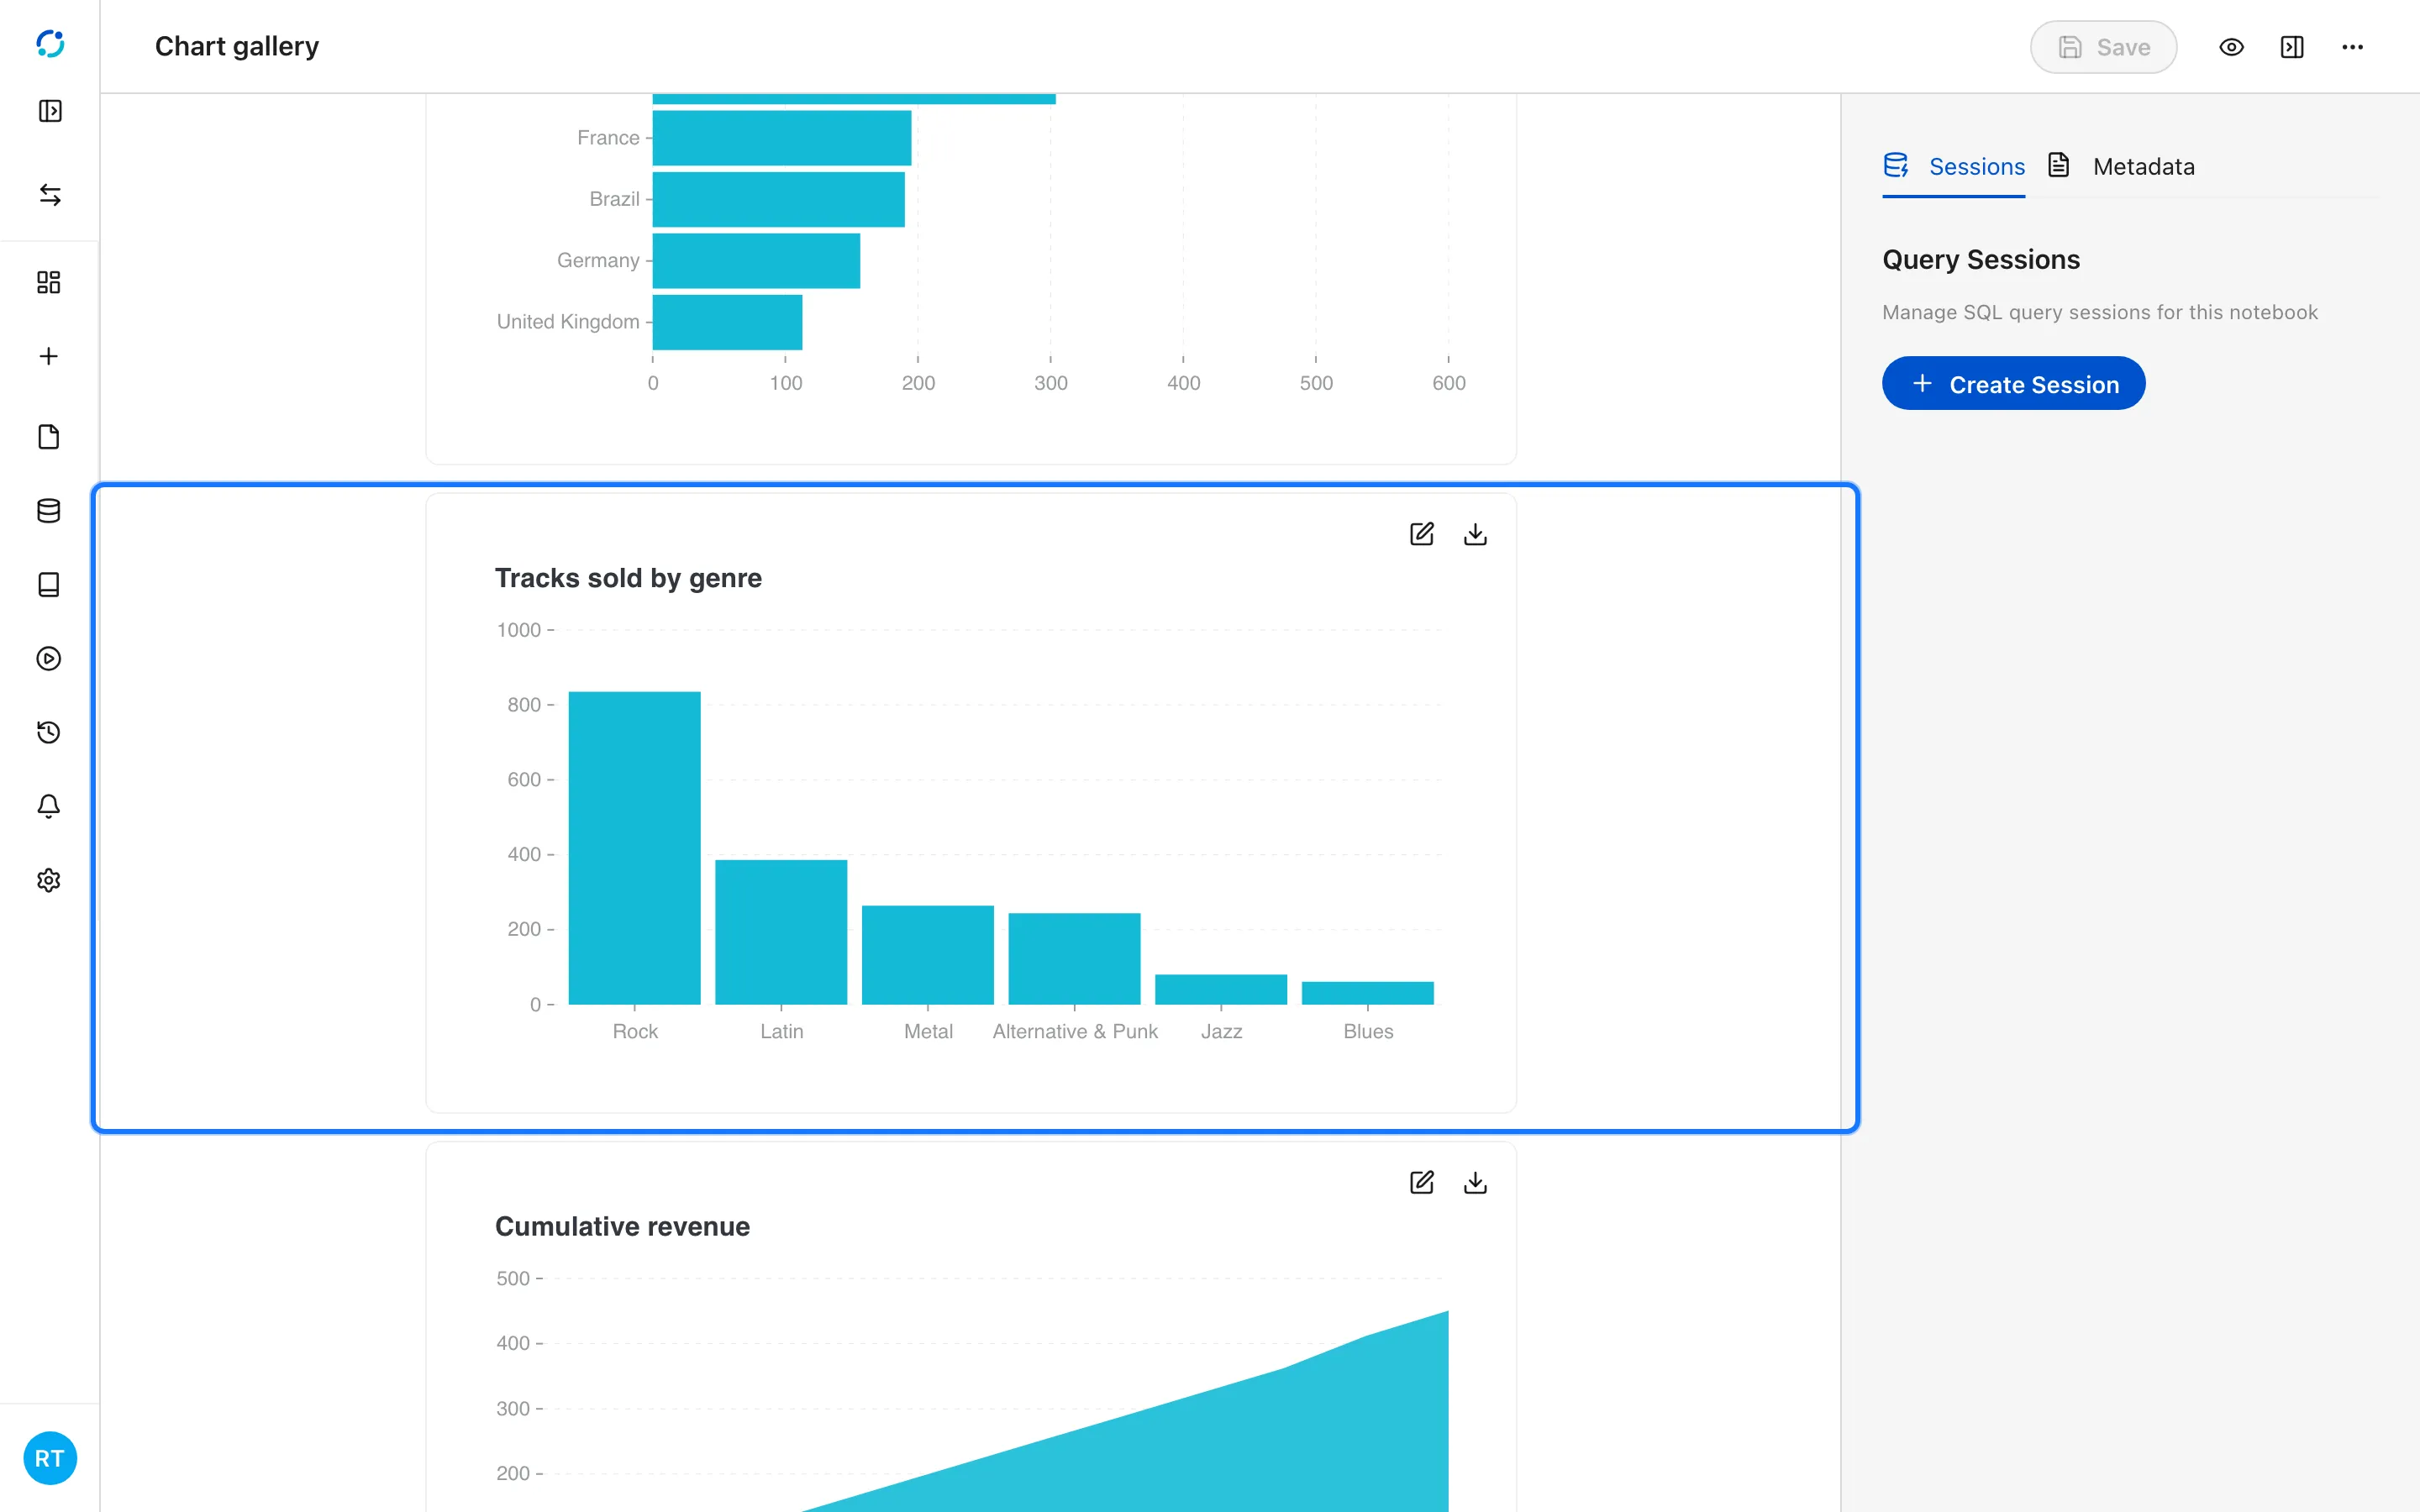
- A column chart compares categories vertically.
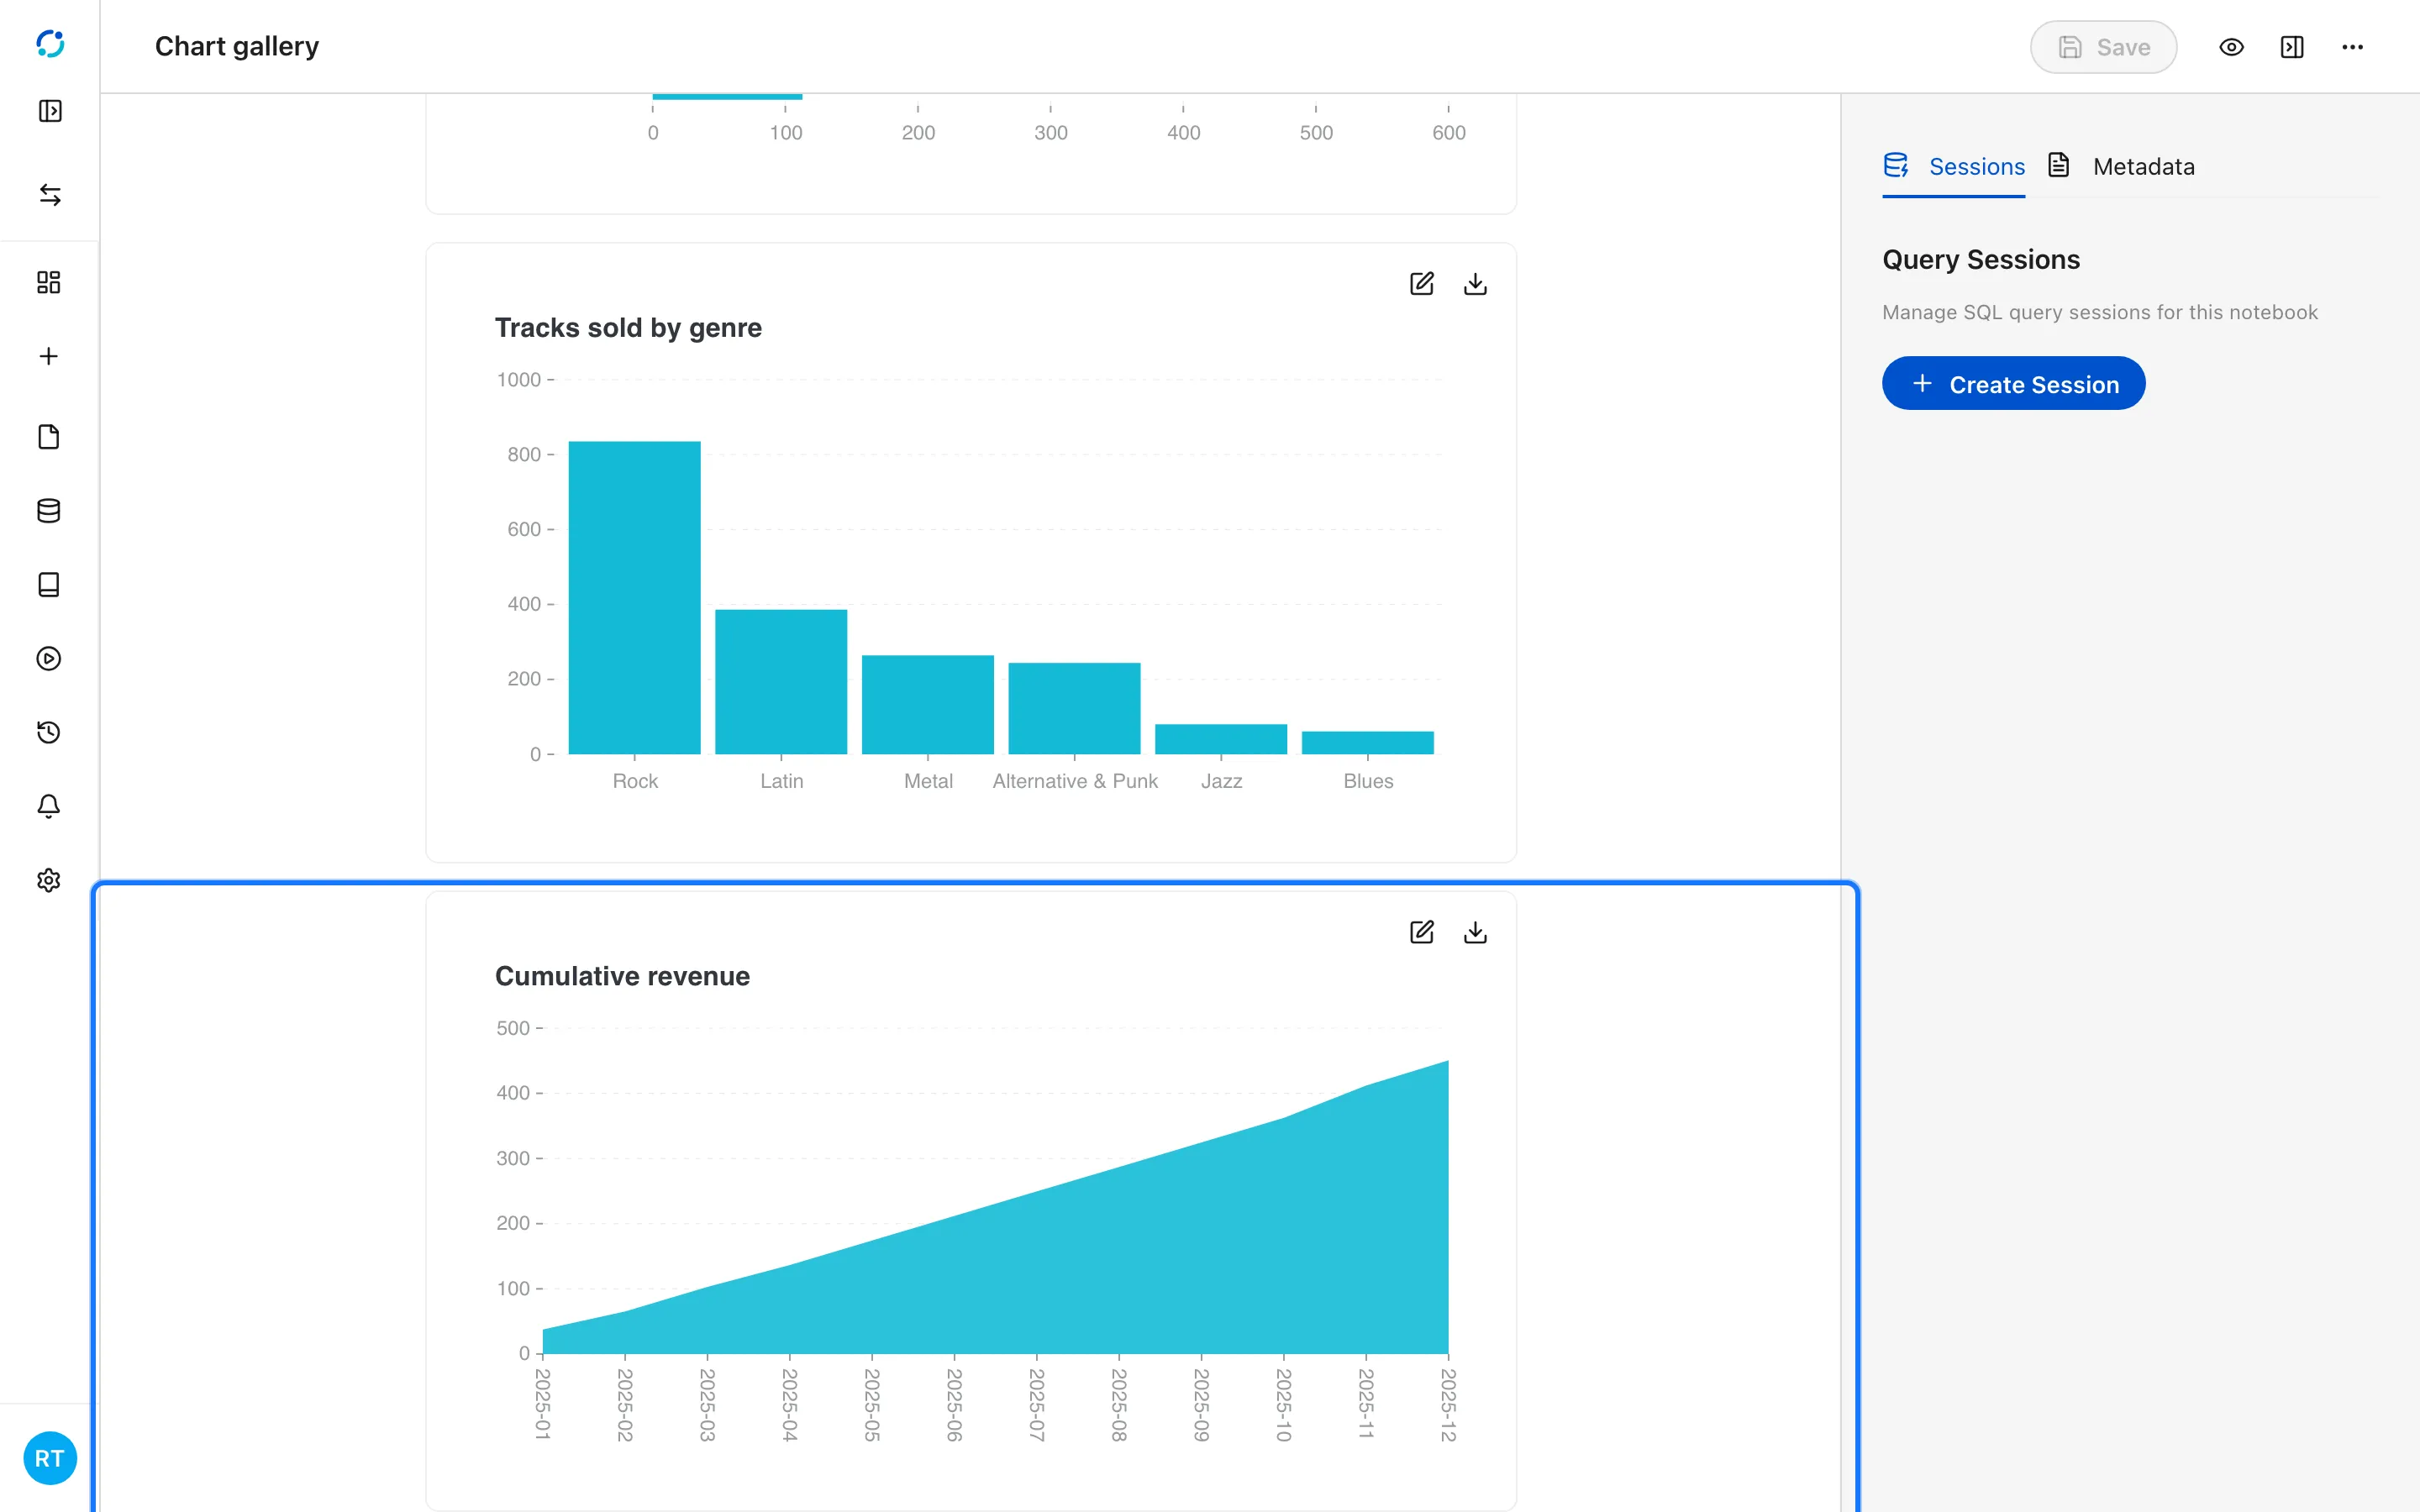
- An area chart emphasizes volume or a running total.
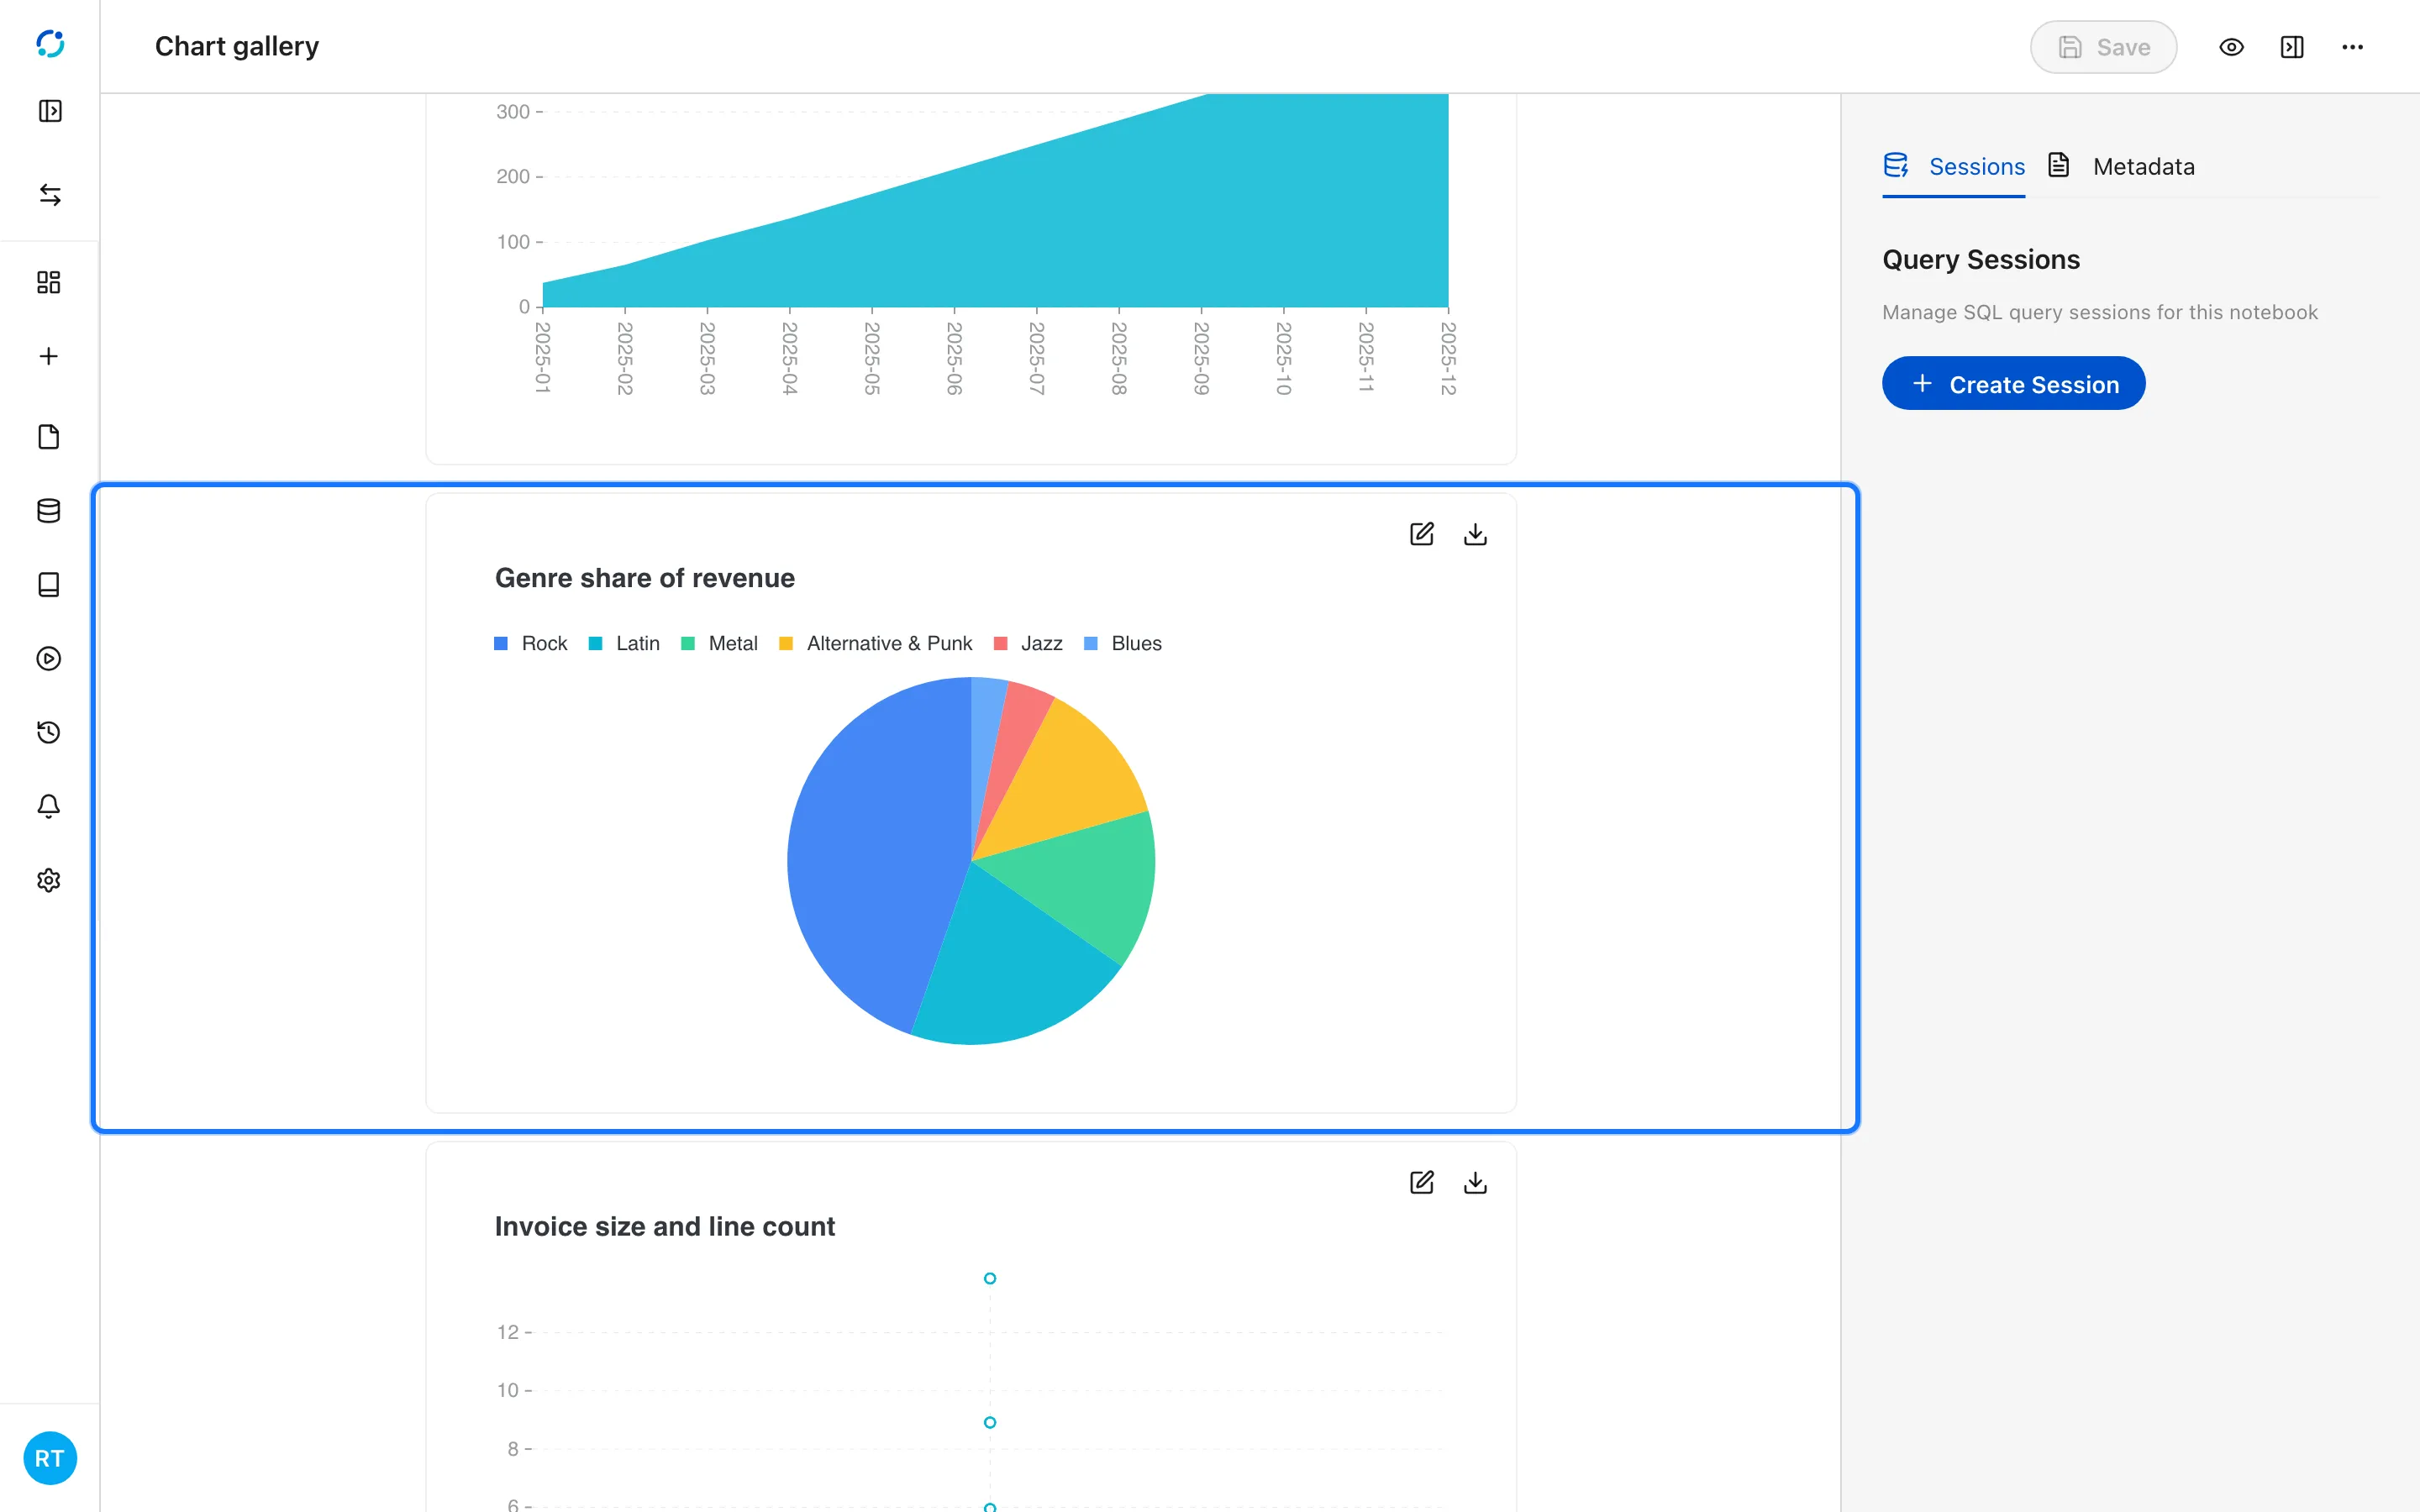
- A pie chart shows composition; keep it to a handful of slices.
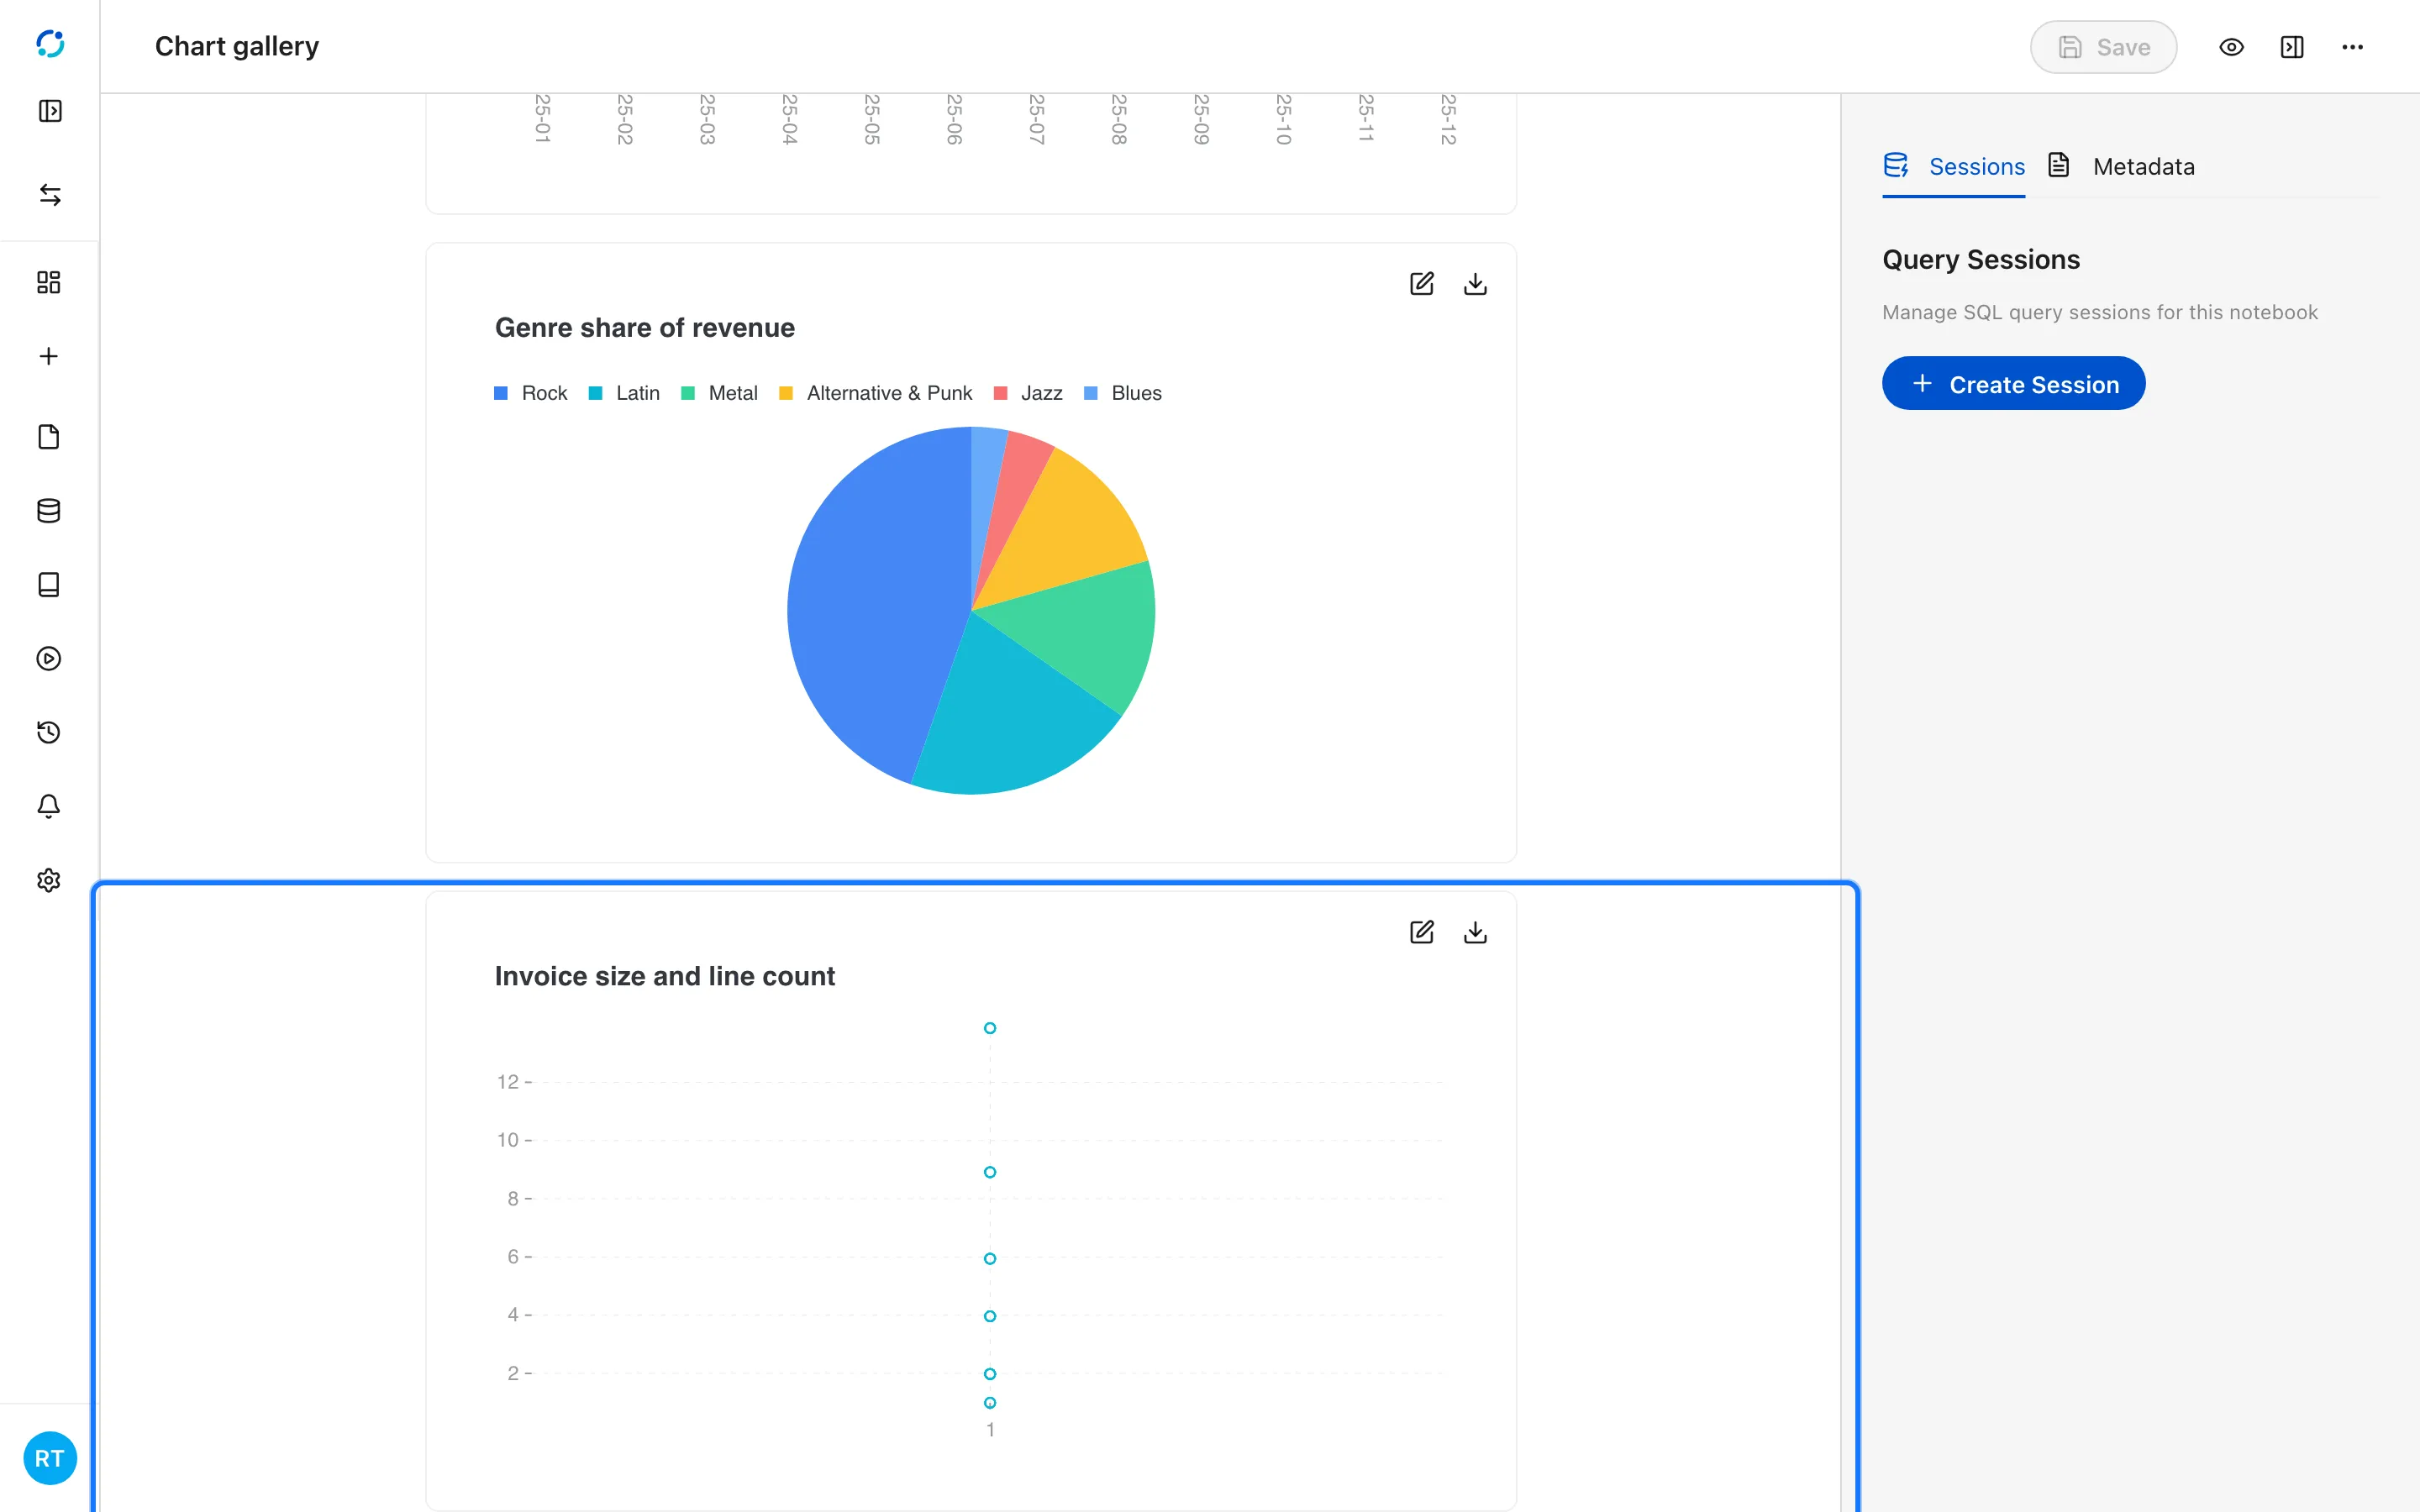
- A scatter chart shows the relationship between two numeric measures.
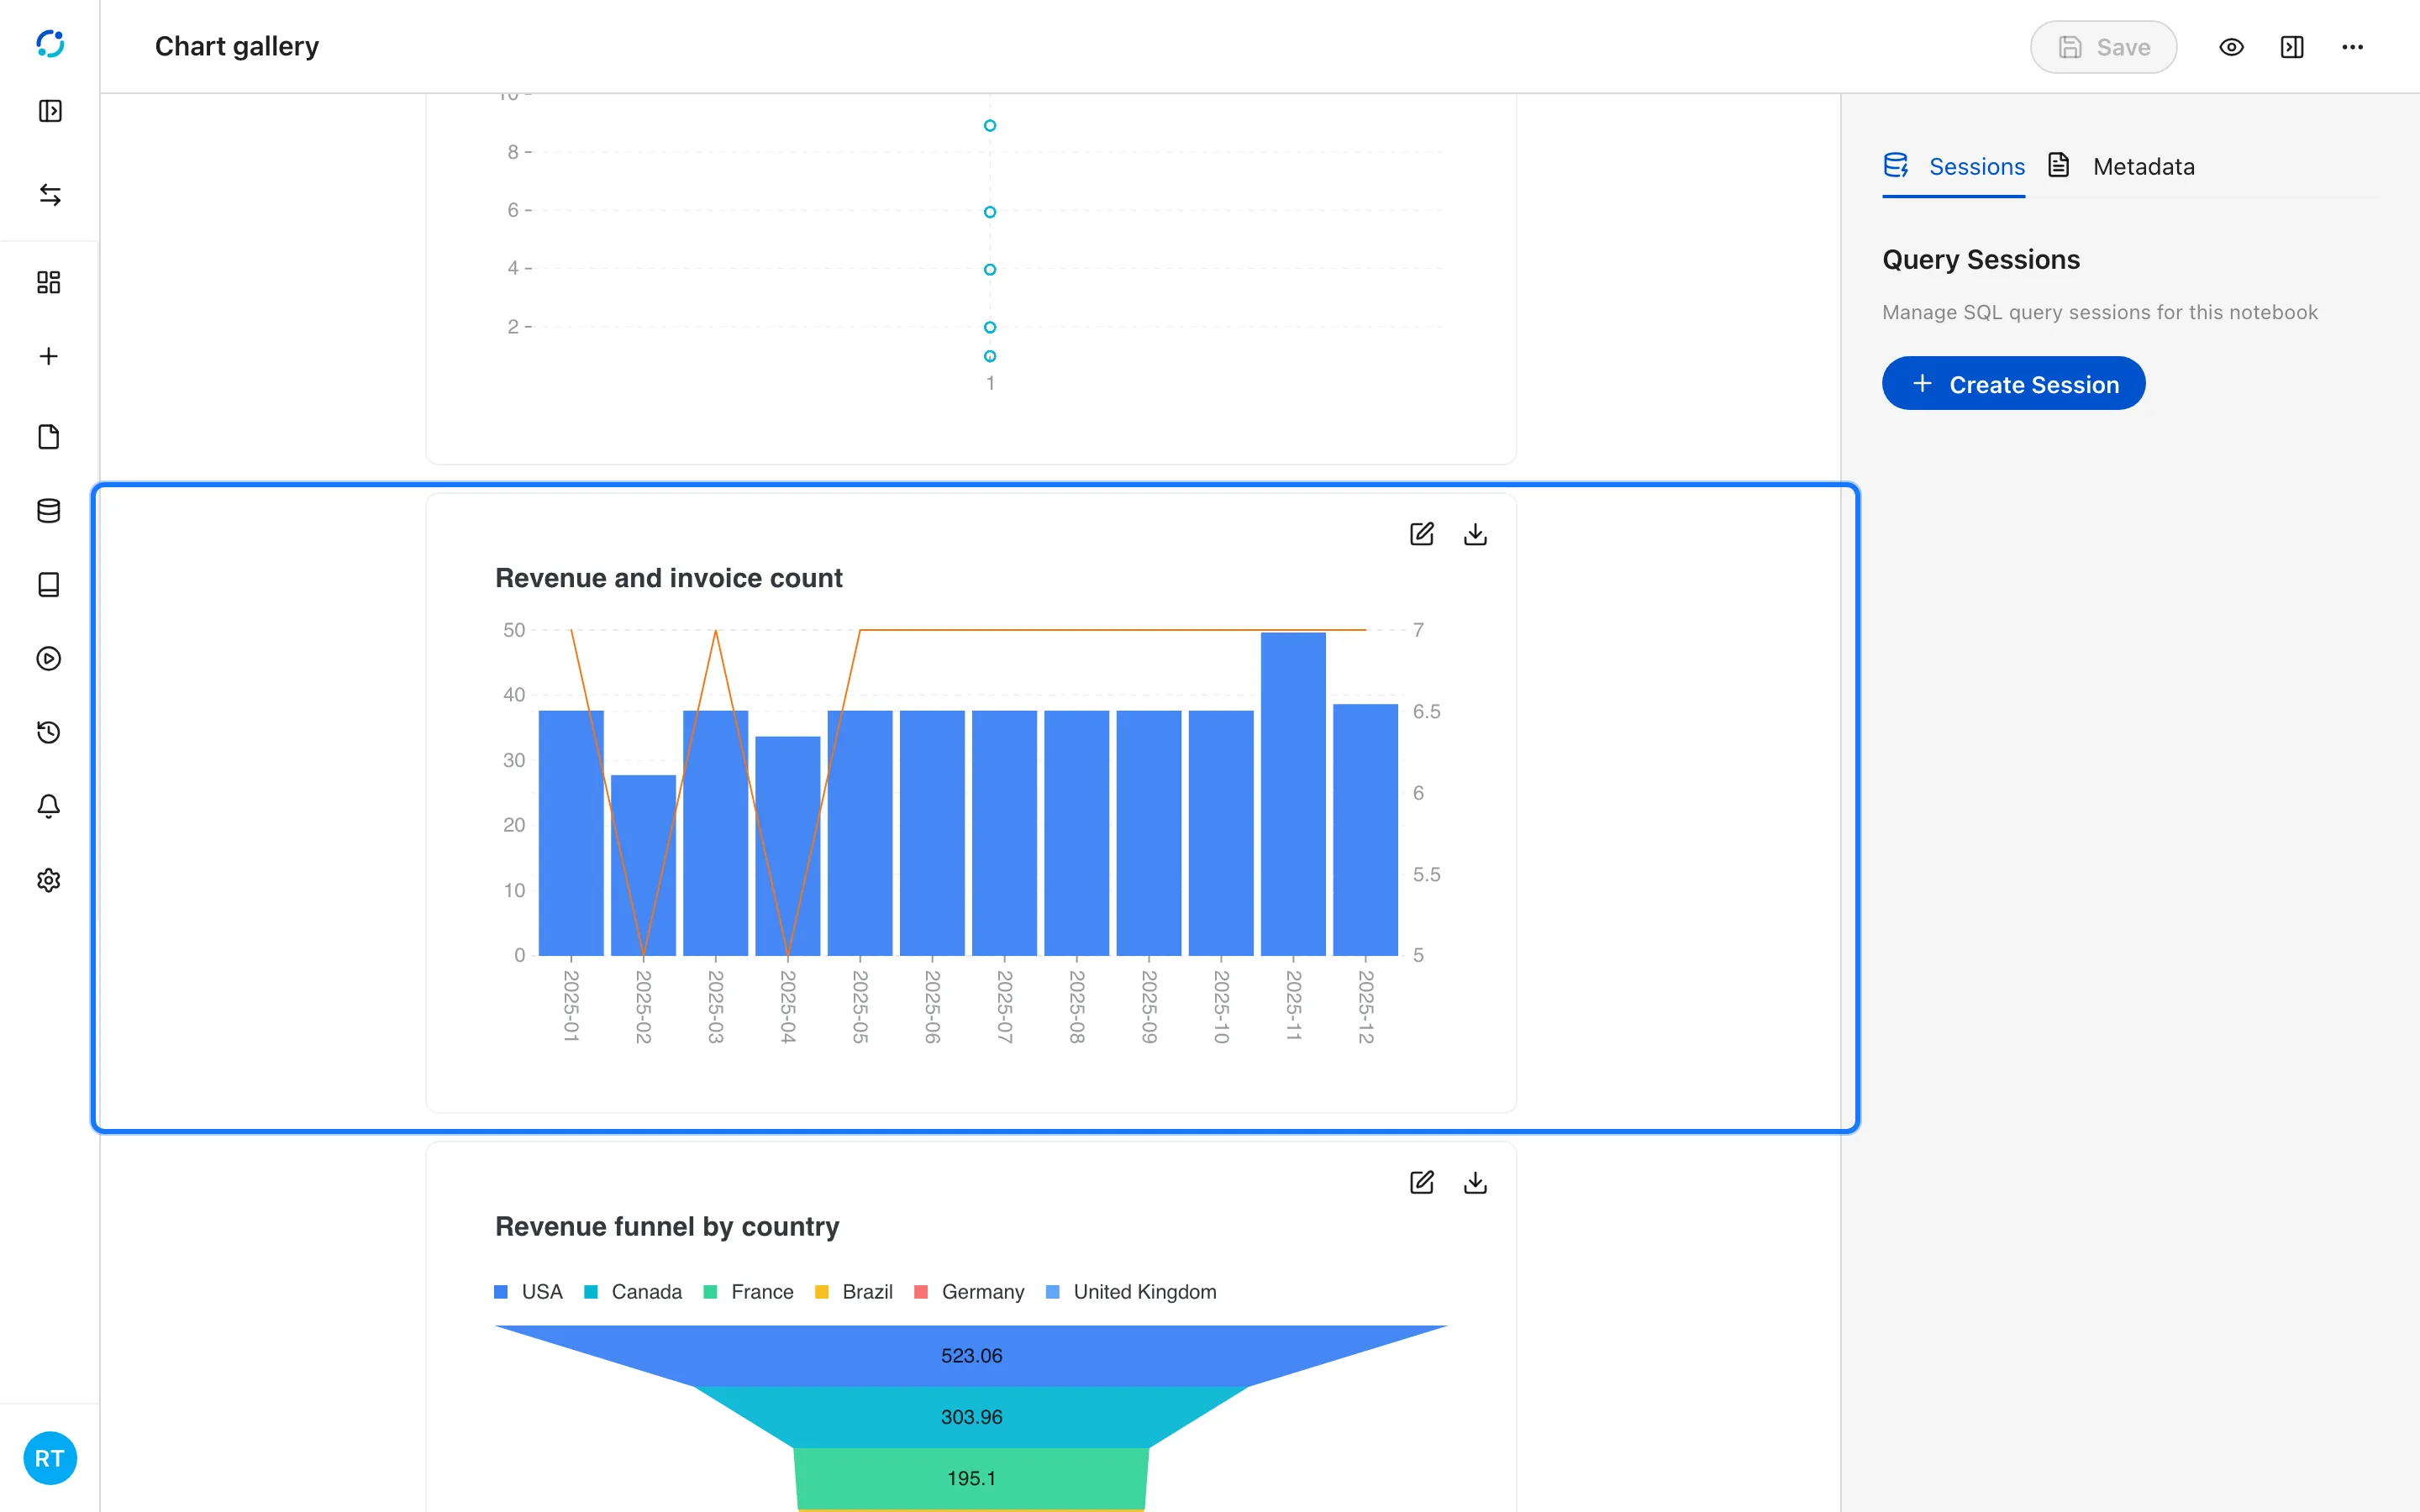
- A dual-axes chart plots two measures with different scales.
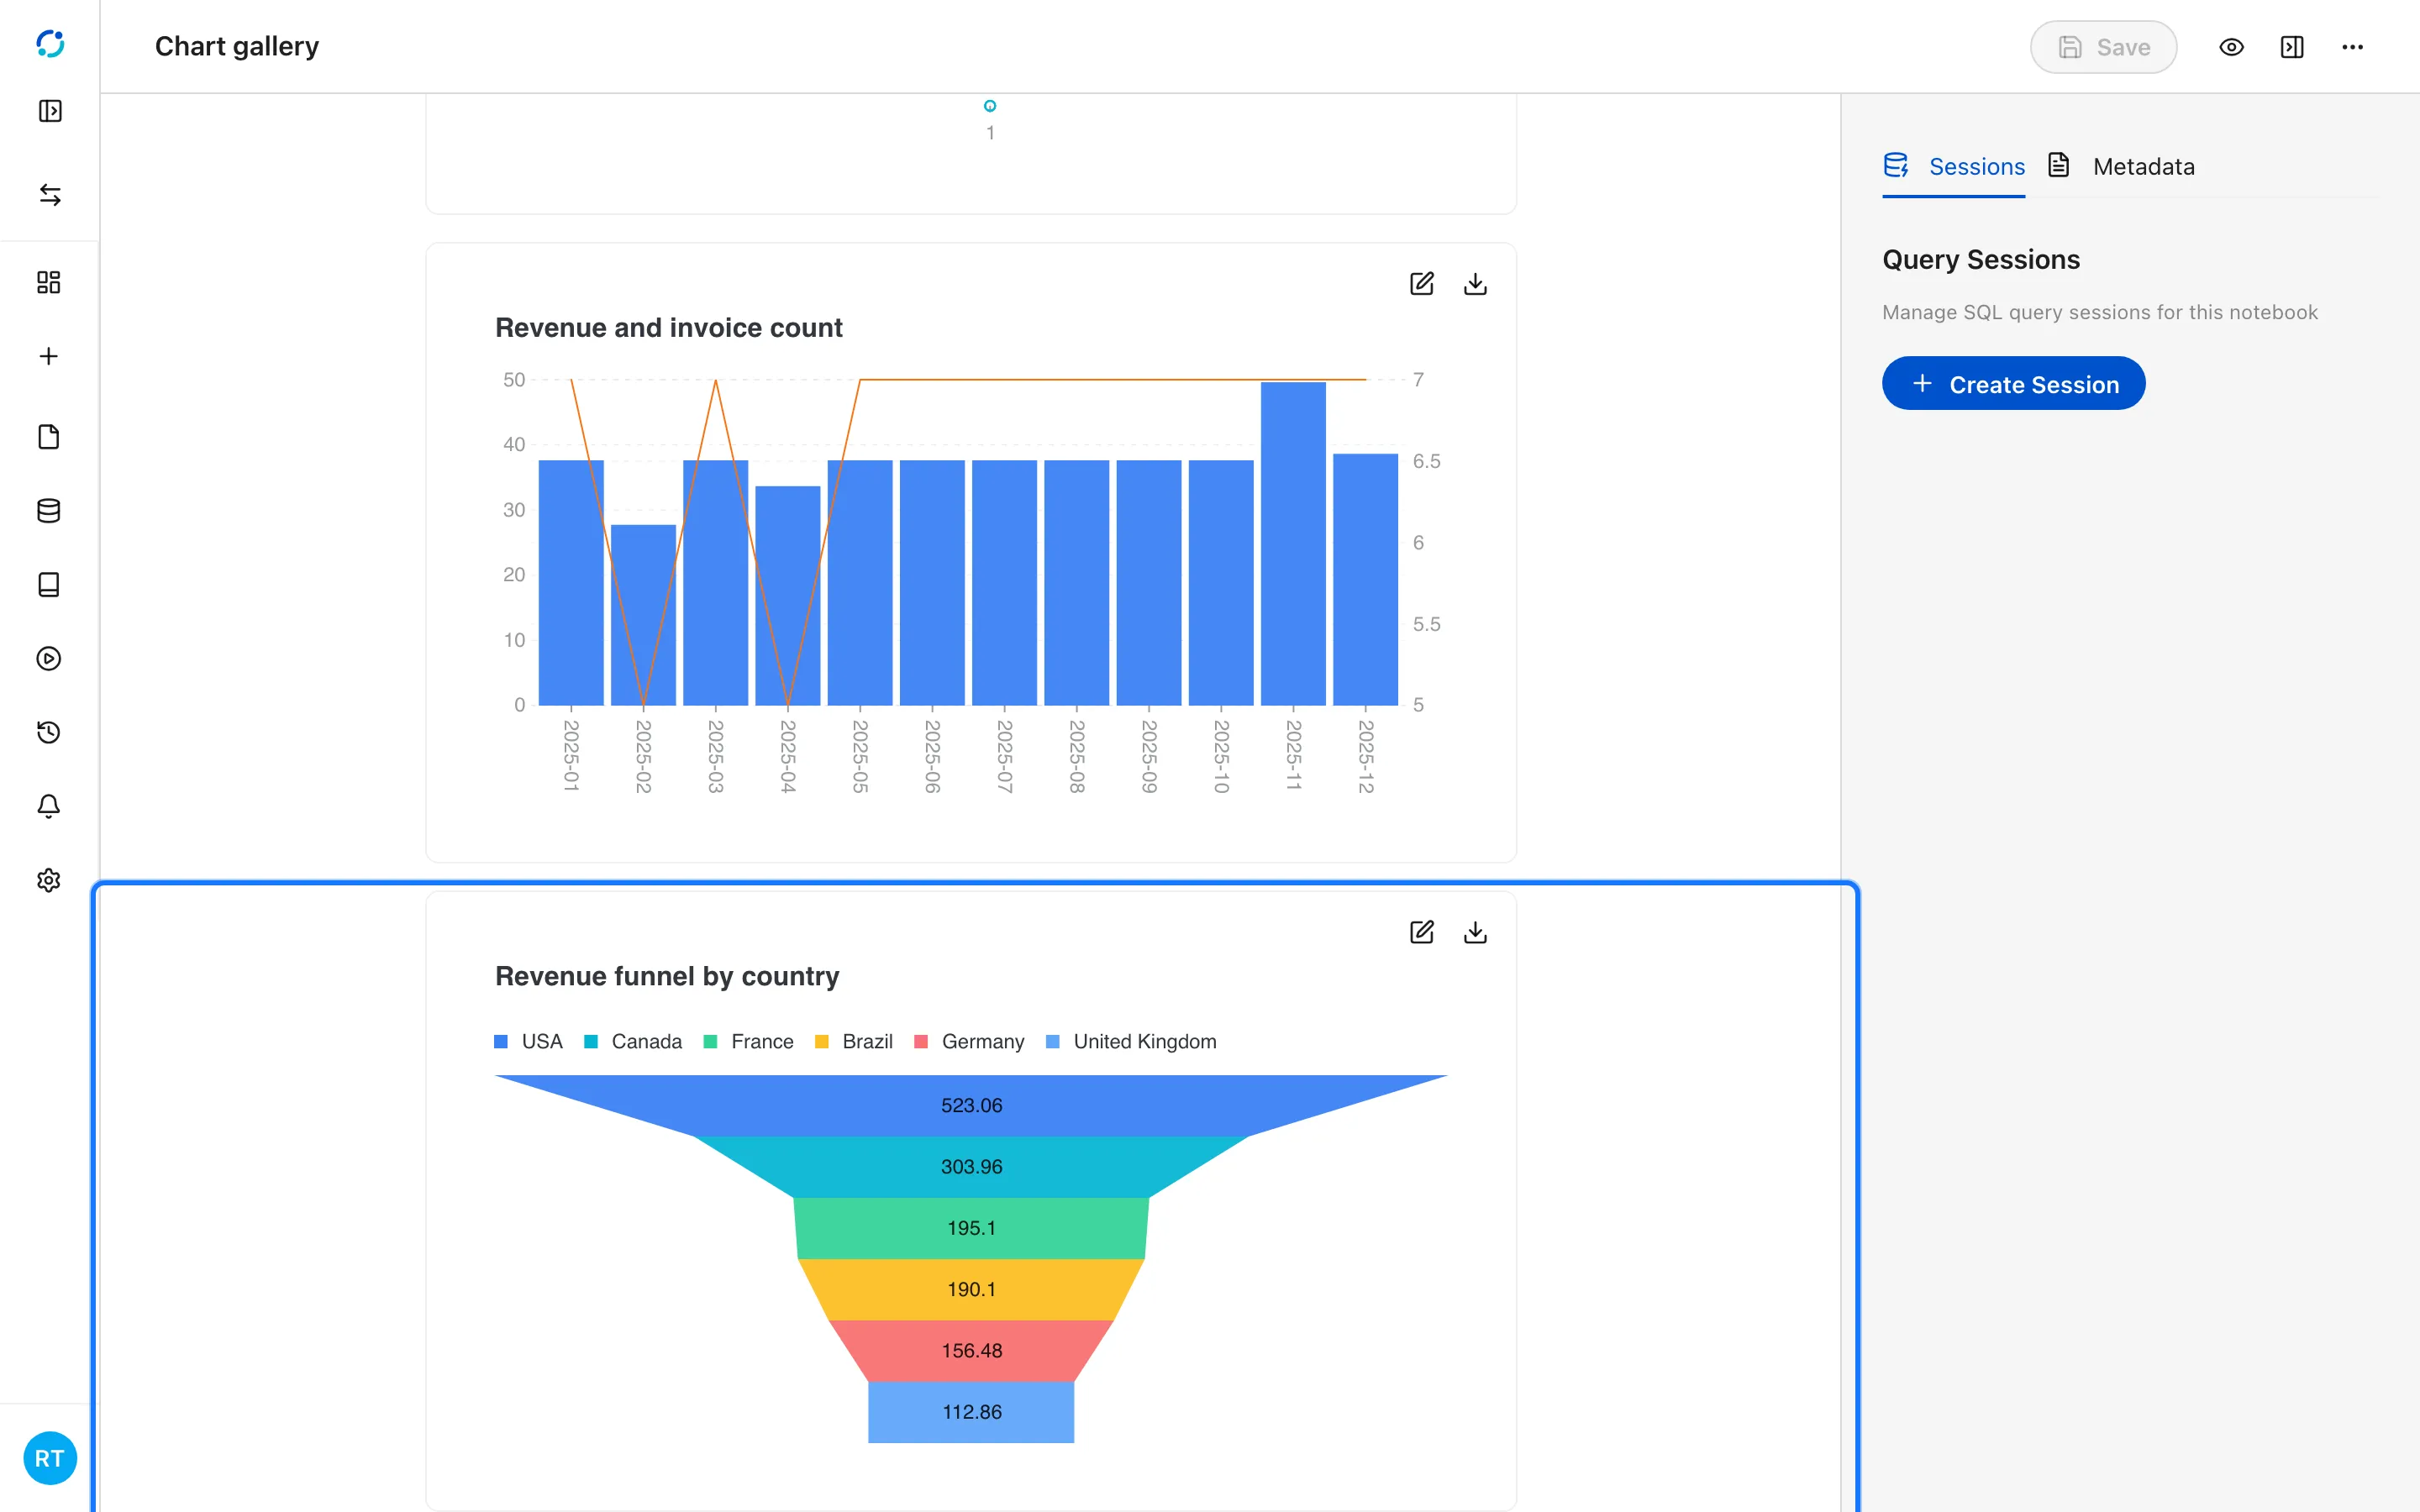
- A funnel chart ranks stages or segments by size.
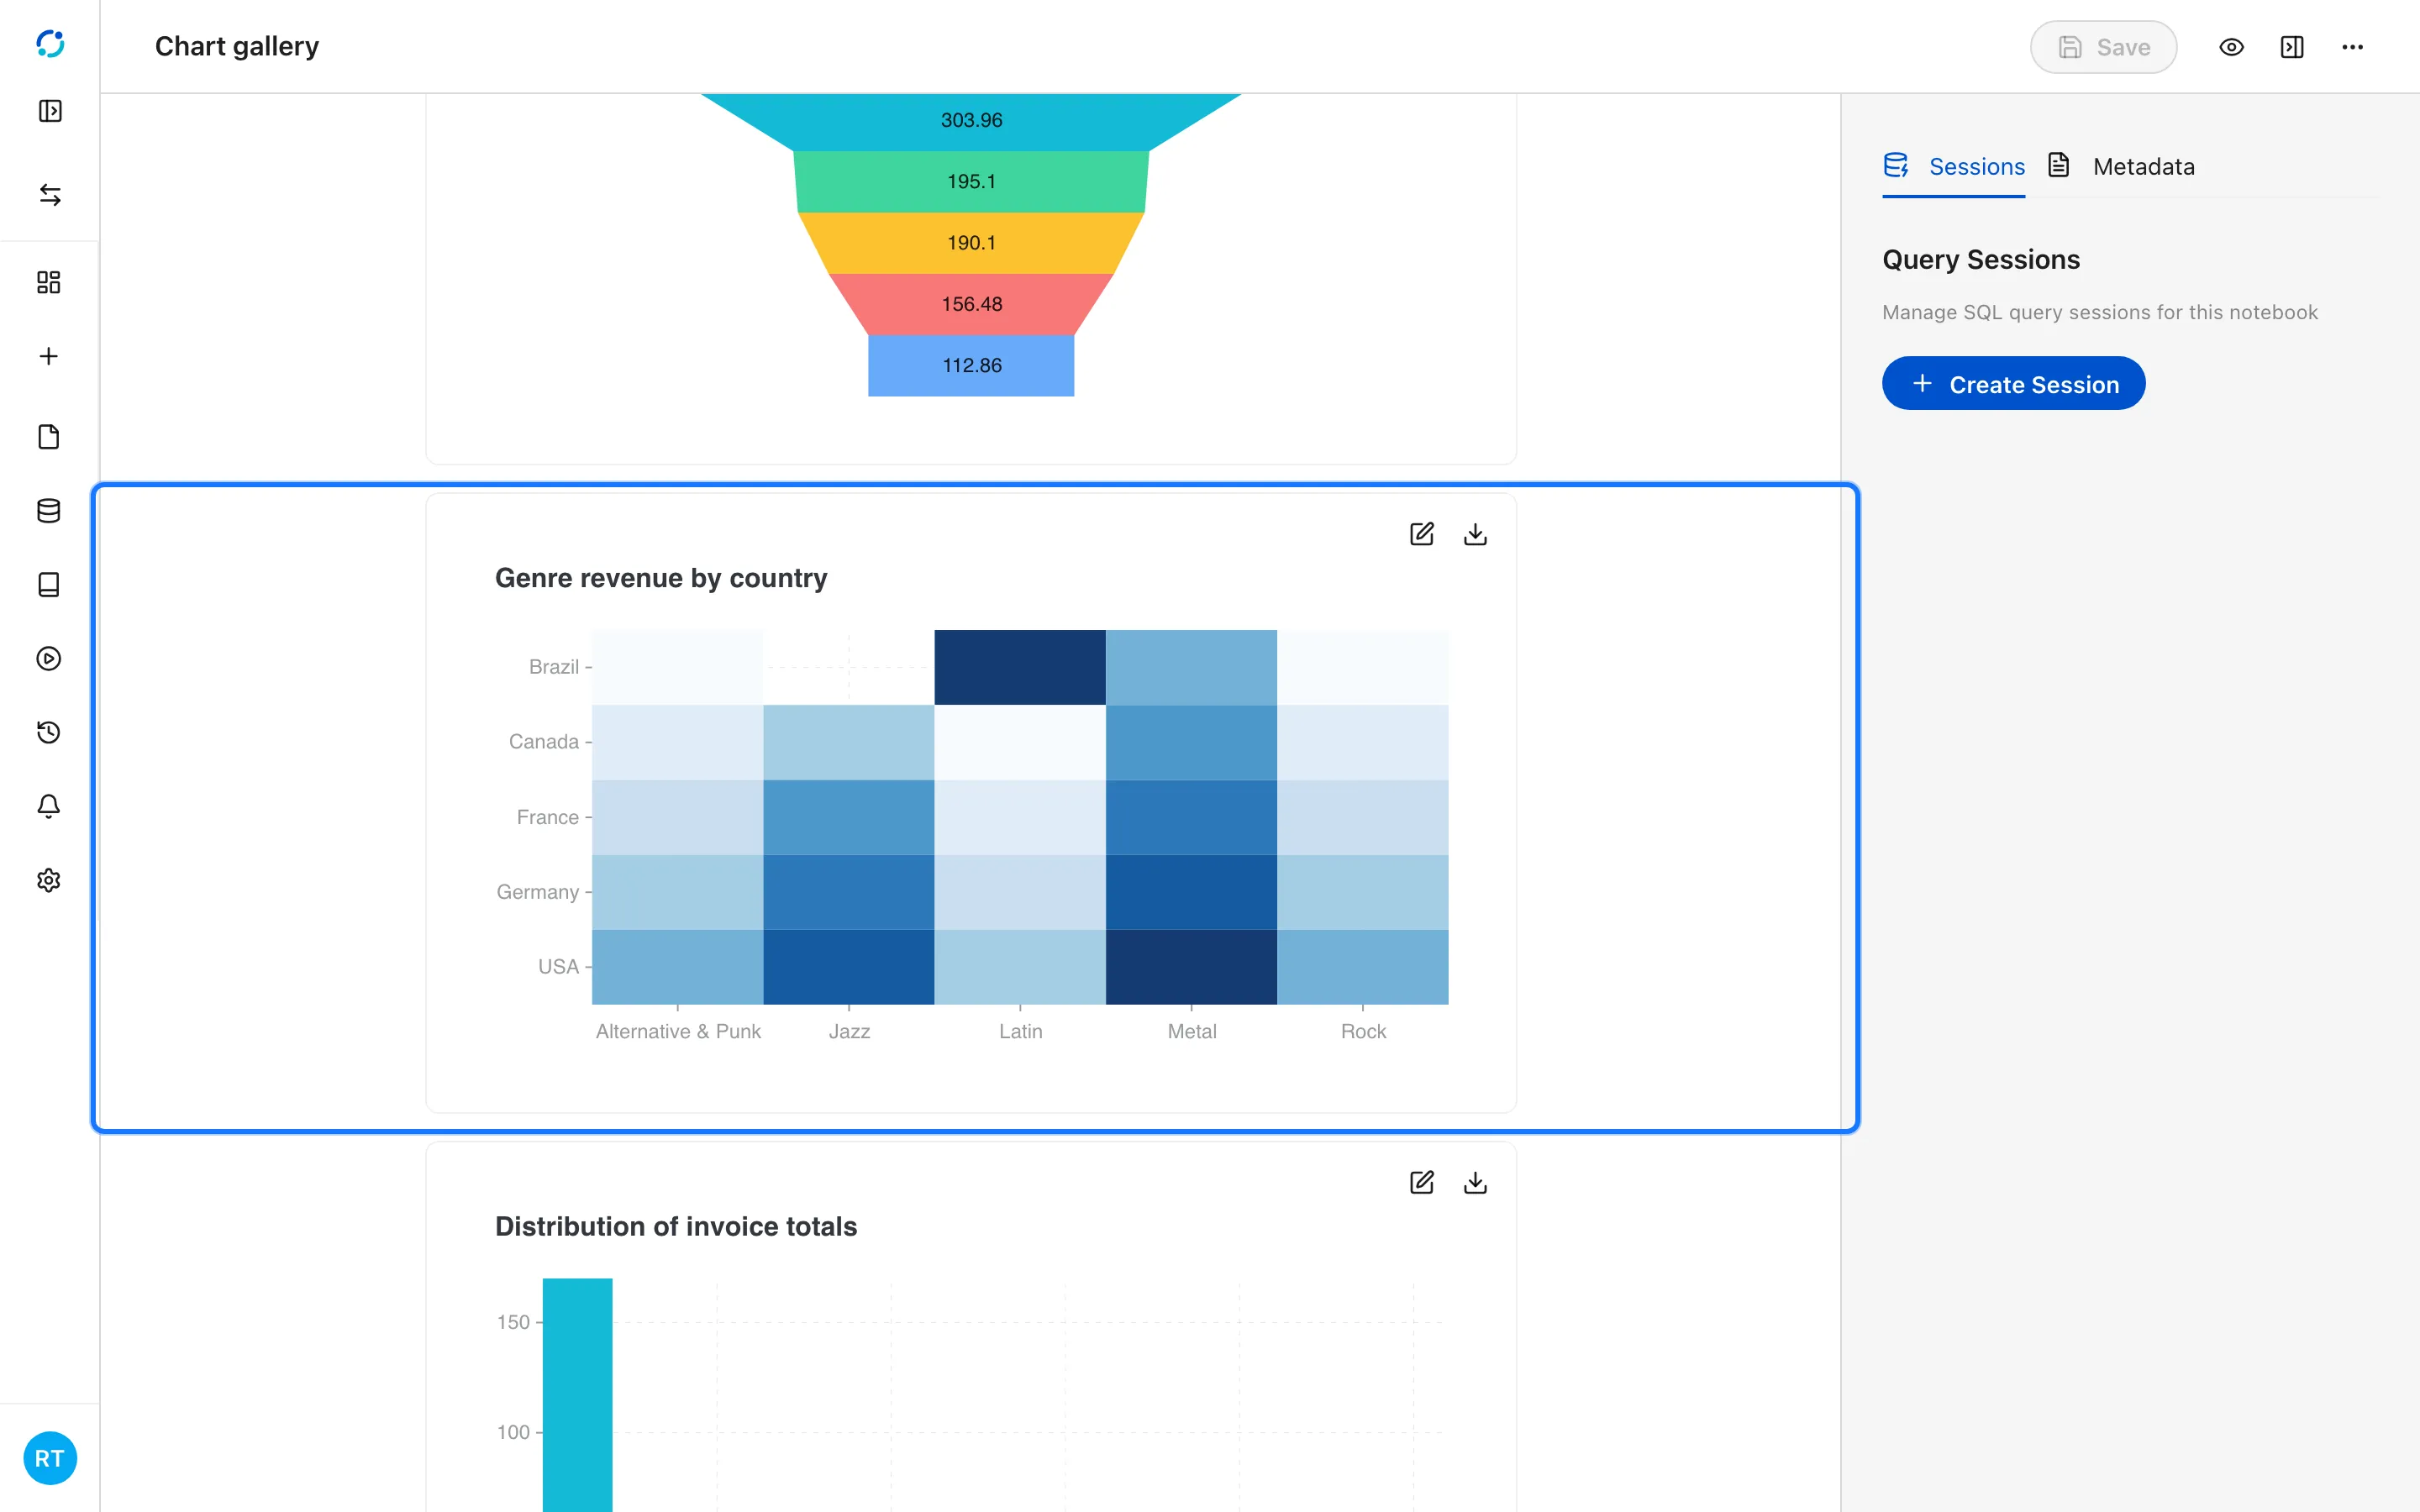
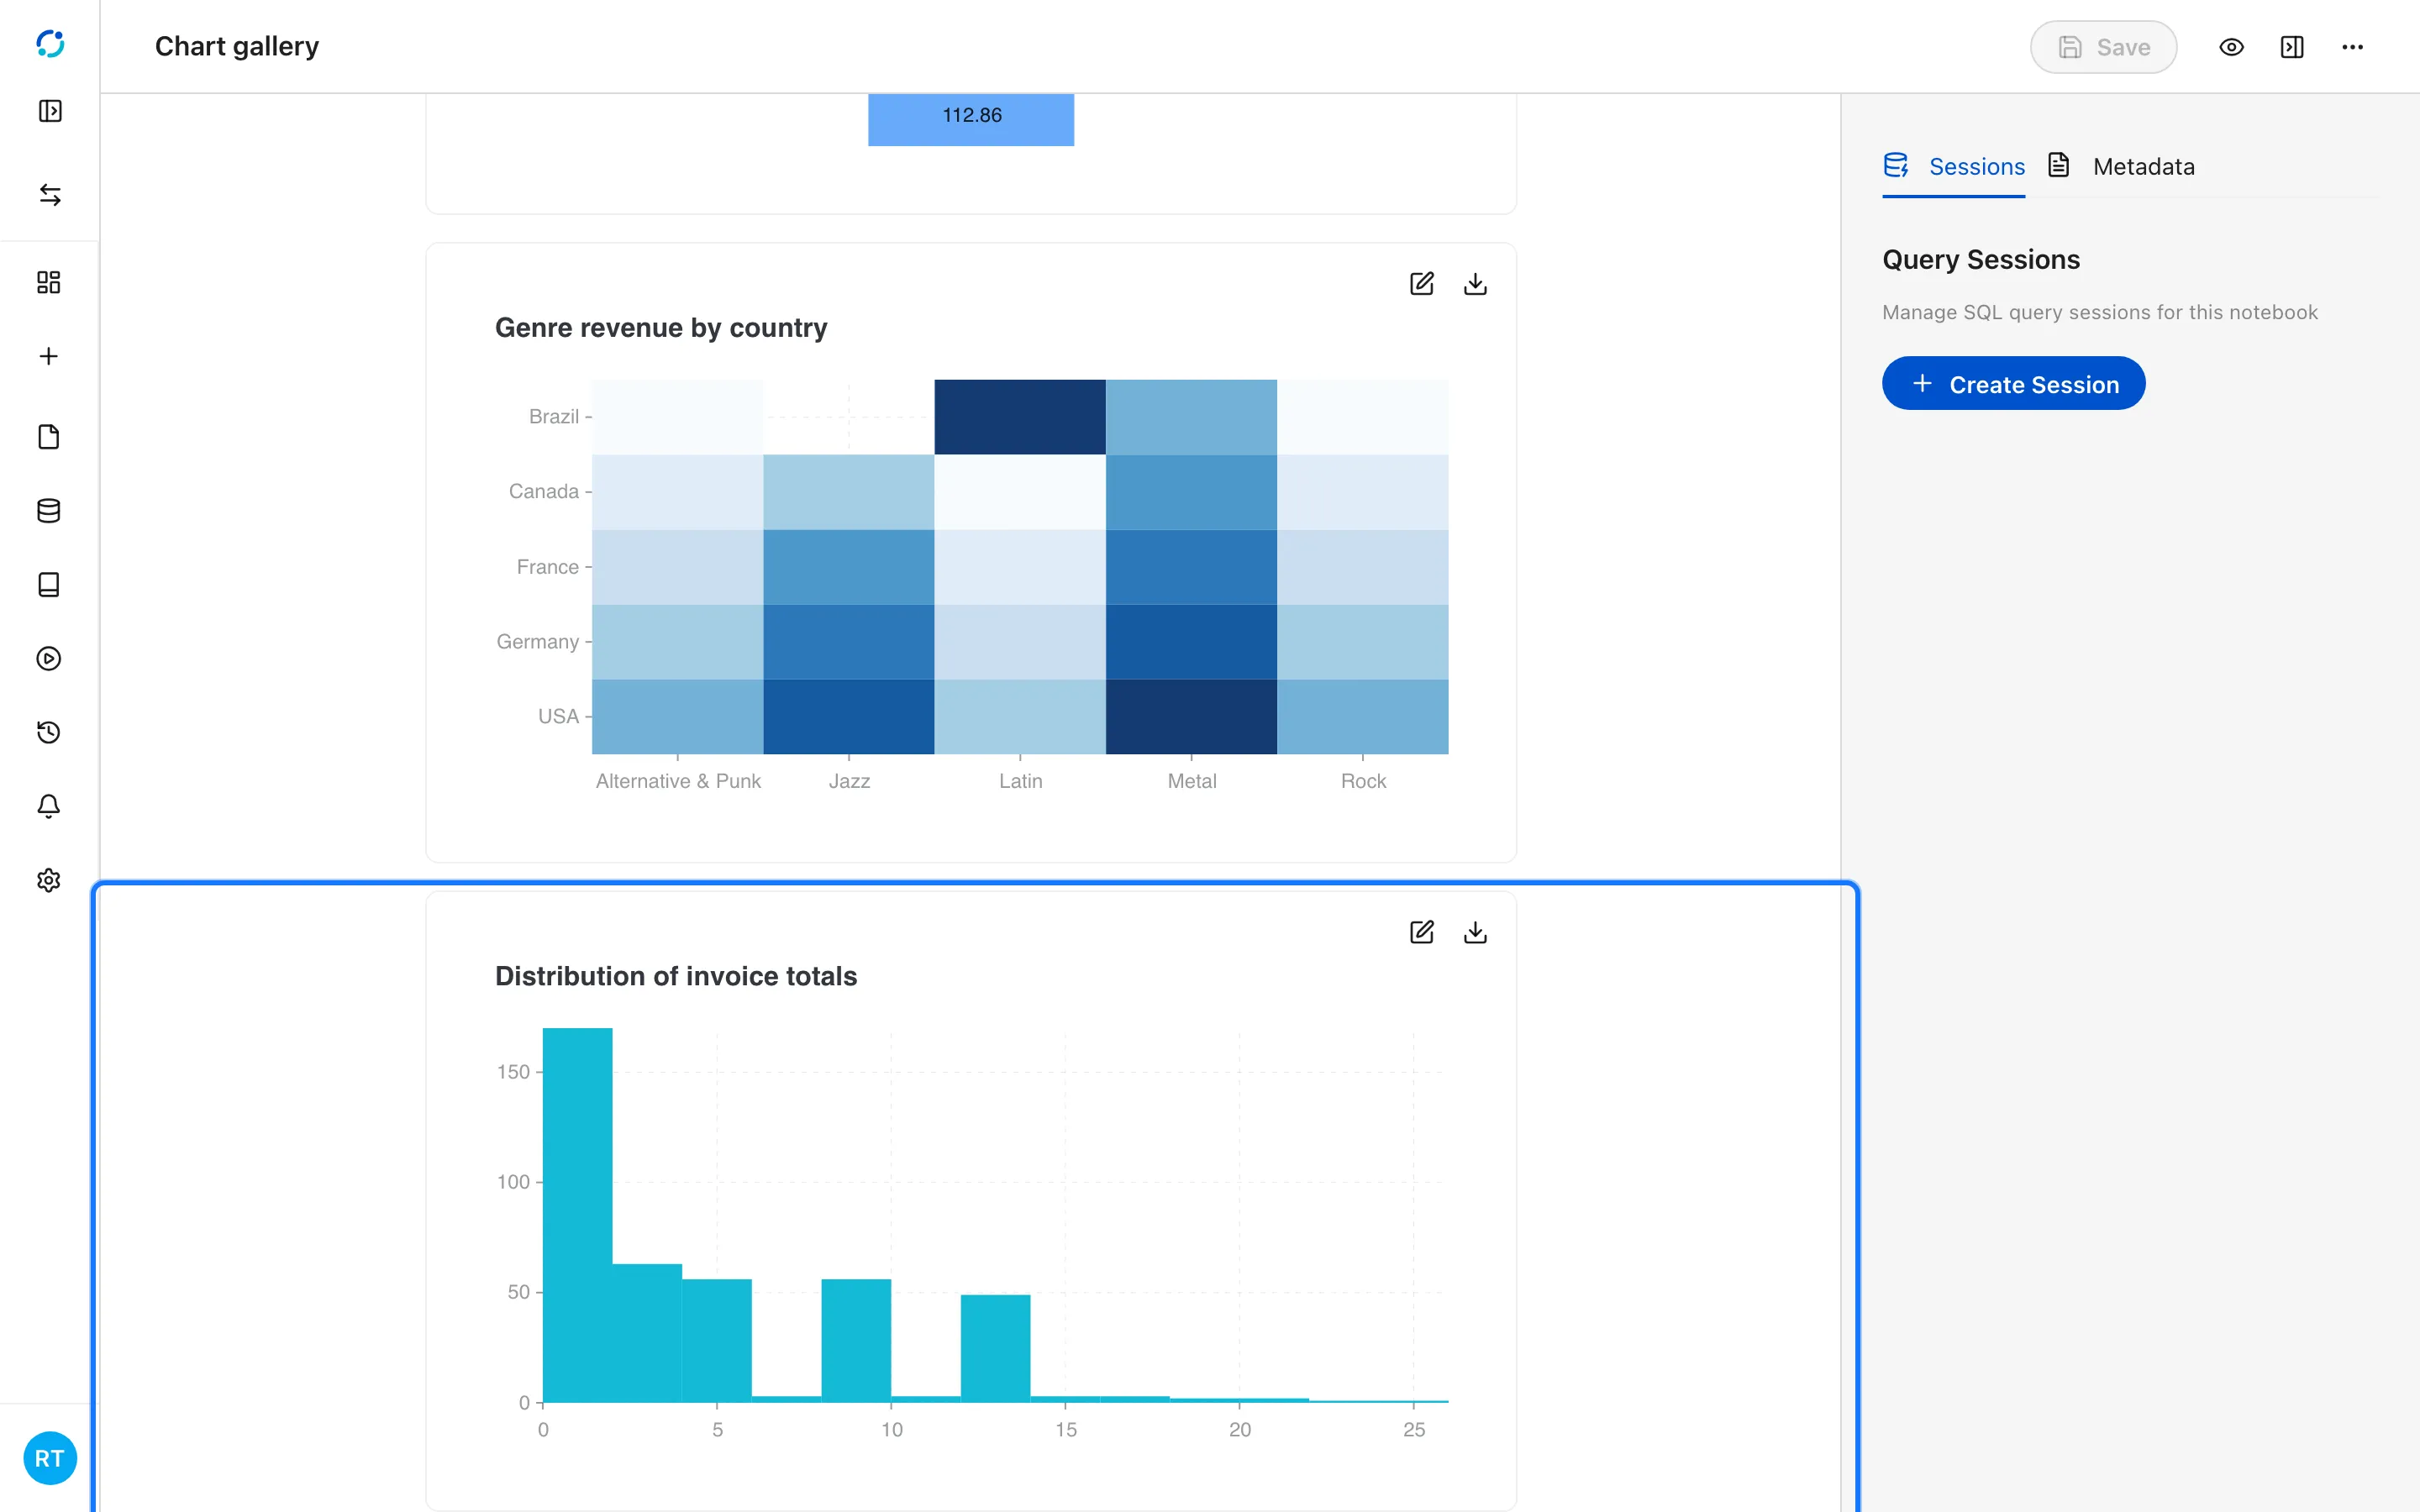
- A heatmap shows intensity across two categories.
- A histogram shows the distribution of one numeric field.
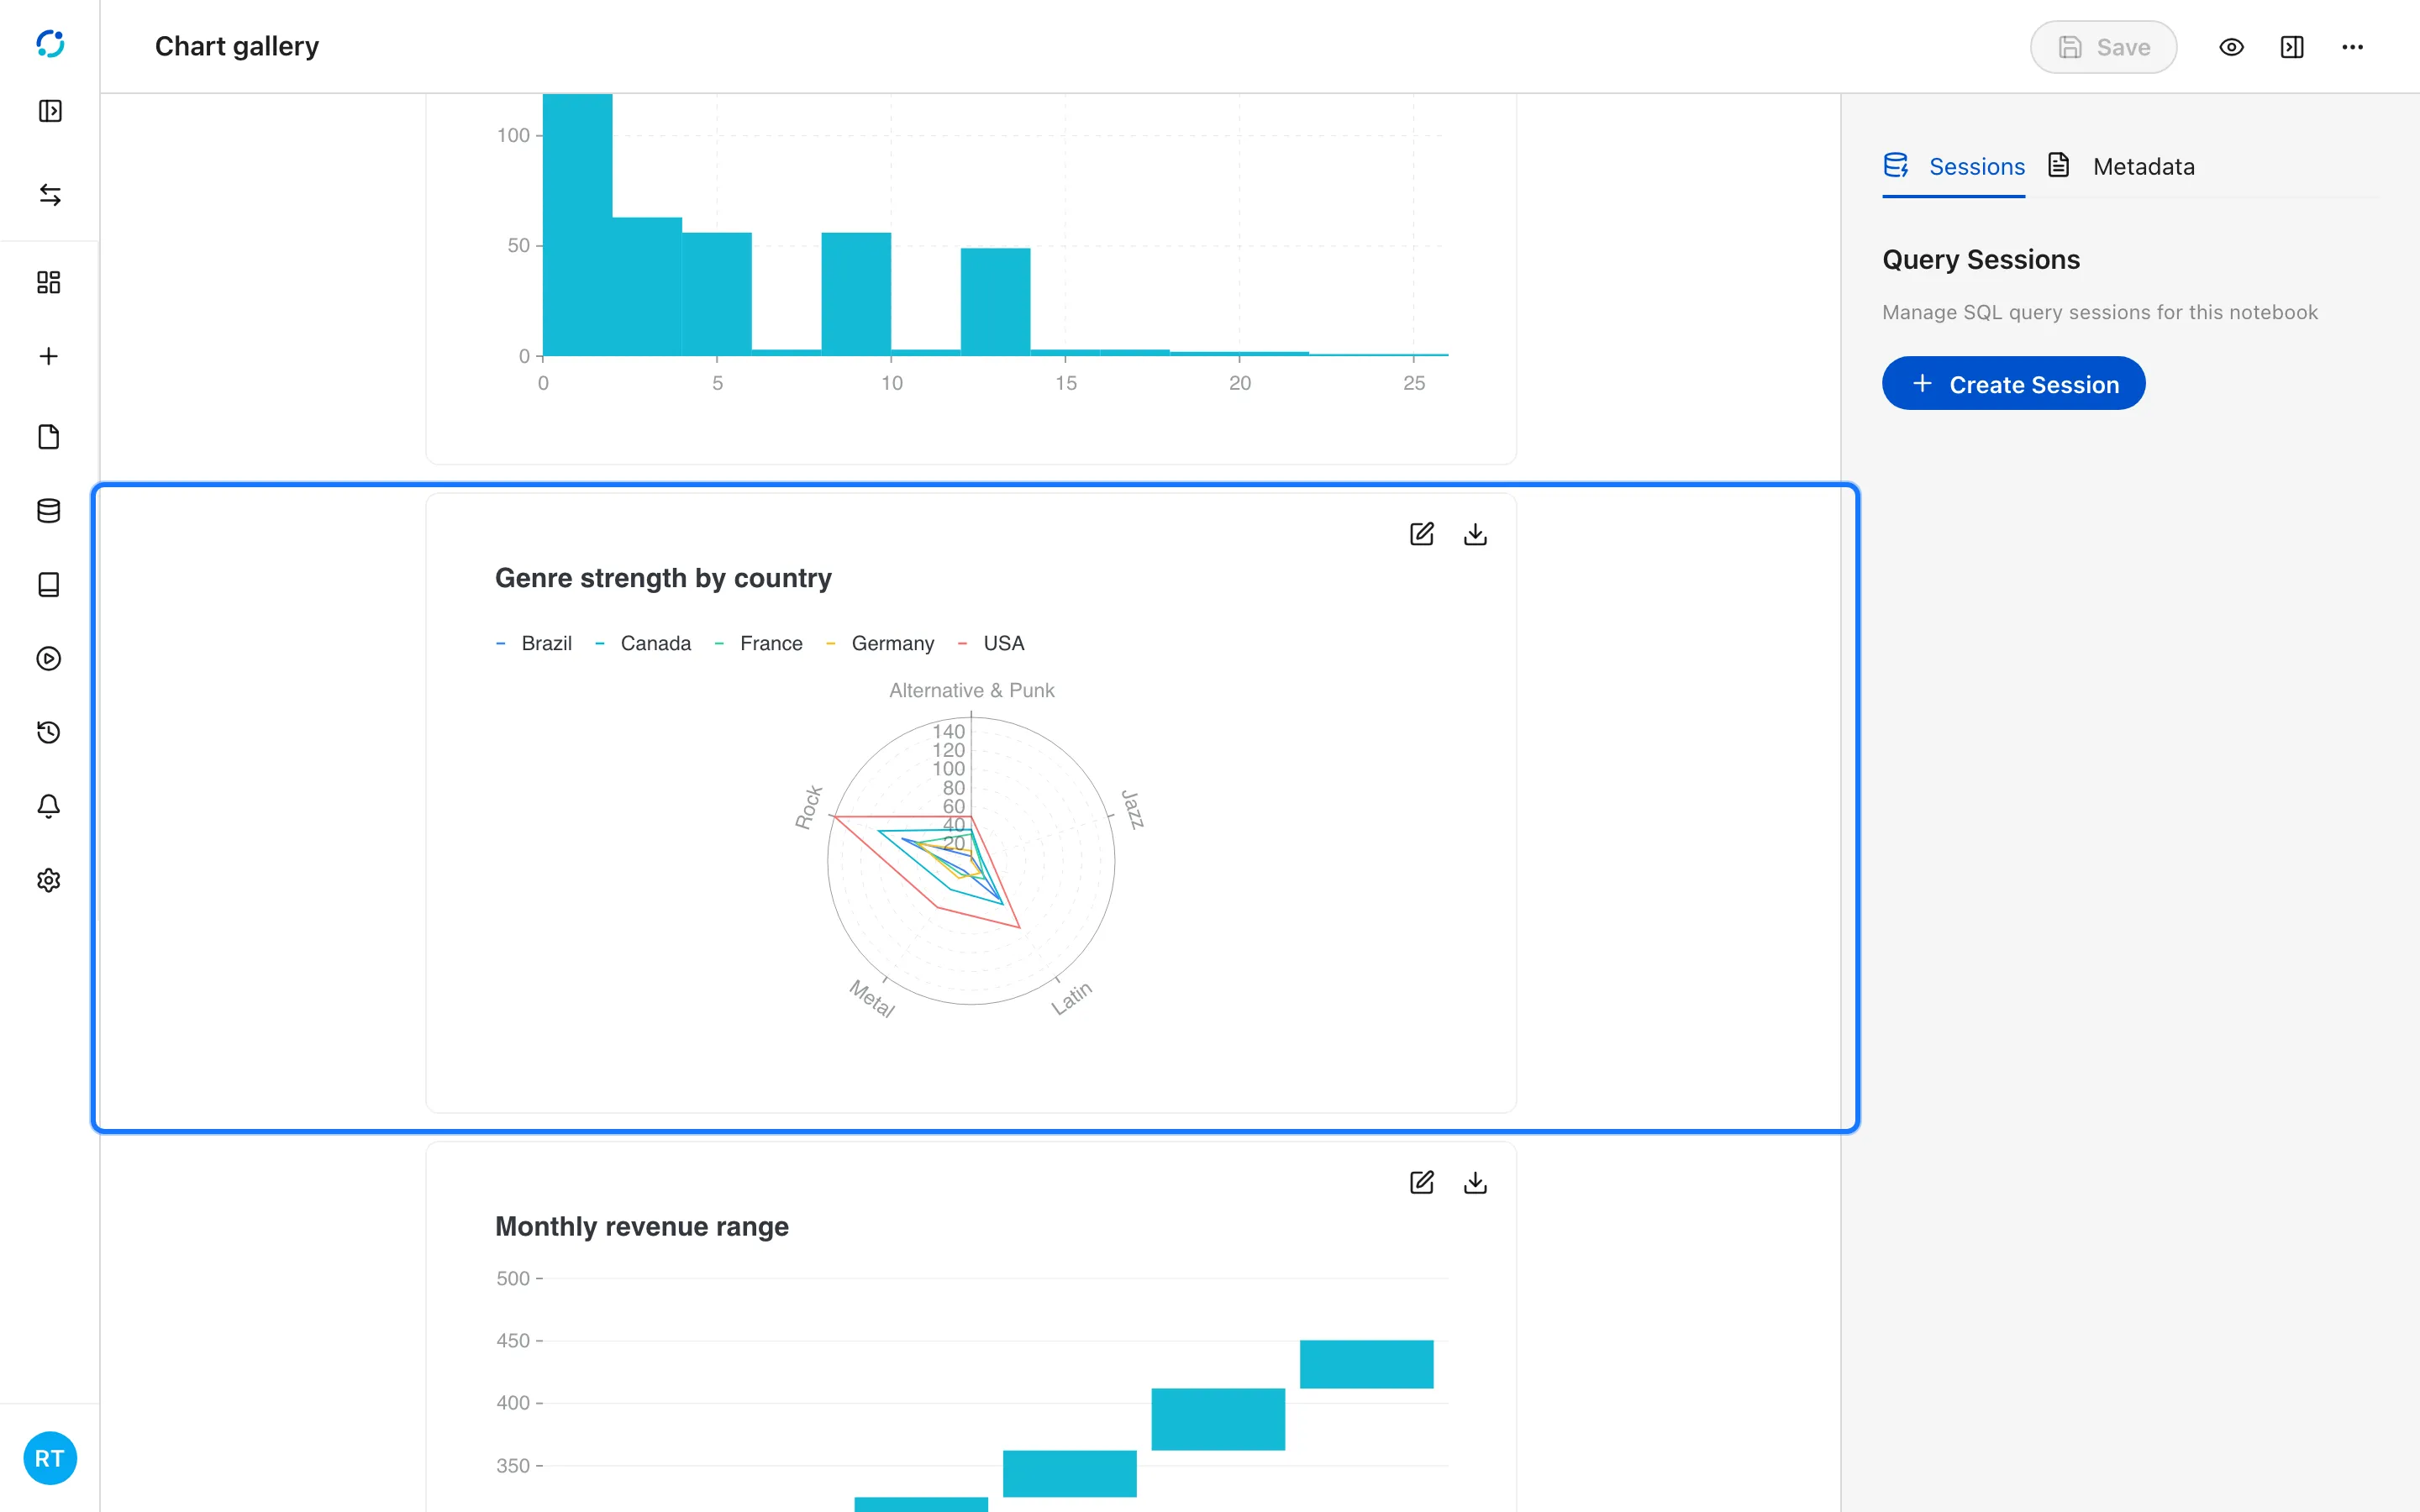
- A radar chart compares profiles across several dimensions.
- A stock chart shows open, close, low, and high for each period.